
NEW ORDER FLOW MARKET DEPTH
指标
4 购买
版本 1.0, Mar 2026
Windows 版、Mac 版
4.0
评价:1
说明
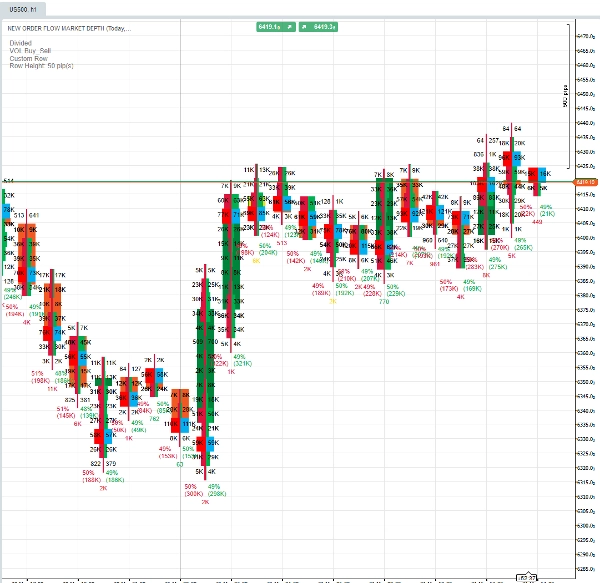
Order Flow Market Depth Pro 将机构交易理念引入零售cTrader平台。通过分析逐笔数据,该指标揭示每根蜡烛内隐藏的买卖压力。无论您交易外汇、指数还是商品,都能通过精准的足迹图和市场深度叠加图了解真实的市场情绪。
主要功能
- 🔍 交易量剖面模式: 可选择普通交易量、买卖拆分或Delta分析。
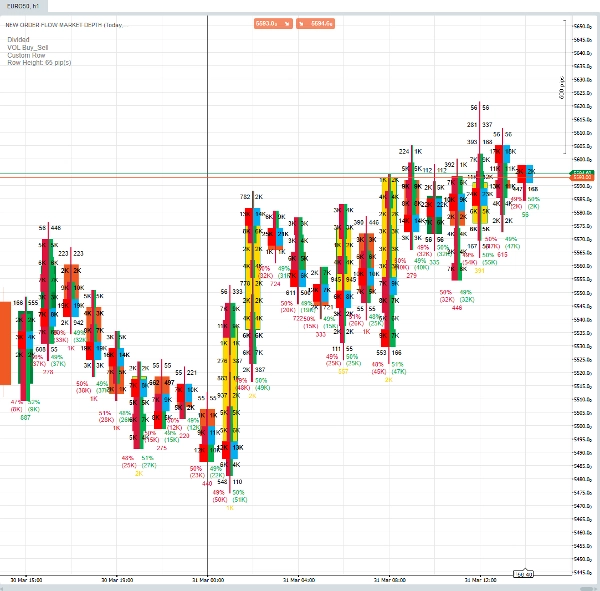
- 📊 足迹图: 在每个价格水平可视化买盘与卖盘交易量(分割或剖面模式)。
- 📈 Delta分析: 通过累计Delta过滤跟踪激进买卖压力。
- 📉 实时市场深度(DOM): 直接在图表上可视化实时限价订单簿(买卖流动性墙)。
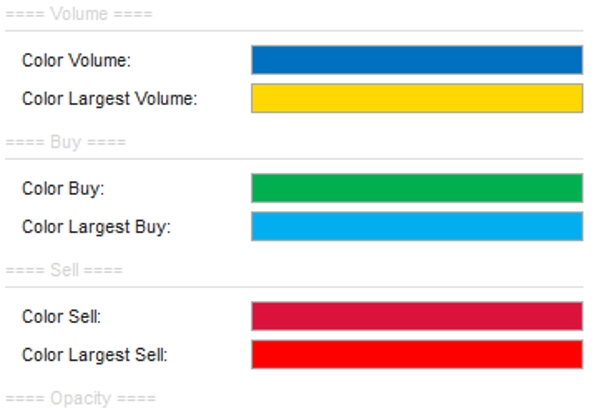
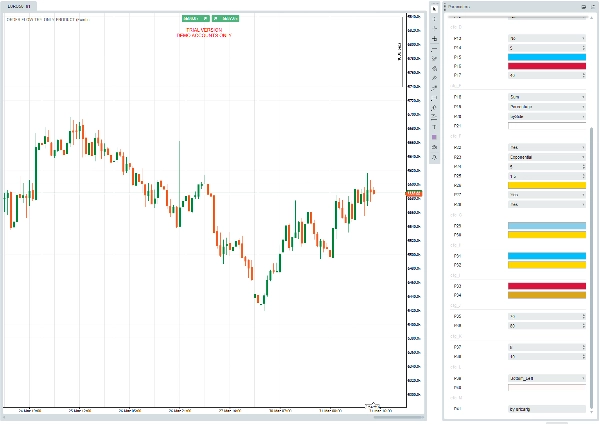
- 🎨 可定制的可视化: 完全可调节的颜色、不透明度、行高和字体大小,以匹配您的交易风格。
- 🚀 智能过滤: 内置移动平均过滤器,突出显示显著的交易量峰值,忽略噪音。
- ⚡ 高性能: 针对Renko、区间和逐笔图表优化,数据处理高效。
试用版详情
- 仅限模拟账户: 此试用版功能完整,但仅限于模拟账户使用。
- 14天限制: 指标自首次附加到图表起,激活14天。
- 视觉水印: 图表上显示试用状态以确保合规。
使用方法
- 将指标附加到您想要的图表上。
- 选择您的 VOL 模式(普通、买卖或Delta)。
- 将 行配置 调整为“预定义”以适应标准时间框架,或“自定义”以适应Renko/区间。
- 启用 显示DOM 以查看实时流动性水平(需要实时数据源)。
- 使用 大结果过滤器 突出显示异常交易量活动的柱线。
需求
- cTrader桌面或网页版平台。
- 访问逐笔数据(由指标自动加载)。
- 模拟账户(试用版专用)。
支持与更新
- 定期更新以兼容新的cTrader版本。
- 专门支持安装和配置问题。
Order Flow, Footprint, Market Depth, DOM, Volume Profile, Delta, Tick Volume, Renko, Range Bars, Institutional, Trial
摘要
AI 摘要
Order Flow Market Depth Pro is an advanced indicator for the cTrader platform that applies institutional trading concepts to retail trading. It analyzes tick-level data to reveal hidden buying and selling pressure within each candle, supporting markets such as Forex, Indices, and Commodities. Key features include multiple volume profile modes (Normal Volume, Buy/Sell Split, Delta Analysis), Footprint charts that visualize bid versus ask volume at each price level, and cumulative Delta analysis to track aggressive buying and selling pressure. The indicator also displays live Market Depth (DOM) overlays showing real-time limit order books and liquidity walls directly on the chart. Users can customize visual elements like colors, opacity, row heights, and fonts to suit their trading style. Smart filtering with built-in Moving Average filters highlights significant volume spikes while reducing noise. It is optimized for Renko, Range, and Tick charts, ensuring high performance and efficient data handling. The trial version is fully functional on demo accounts for 14 days and includes a visual watermark. Requirements include the cTrader Desktop or Web platform and access to tick data, which the indicator loads automatically. Regular updates and dedicated support are provided for installation and configuration.
指标配置
指标分类
订单流/深度图
输出类型
可视化
数据要求
仅 K 线
跳动点数据
市场深度
交易量
支持的信号
时段开盘区间
背离
客户评价
4.0
评价:1
5 | 0 % | |
4 | 100 % | |
3 | 0 % | |
2 | 0 % | |
1 | 0 % |
客户评价
April 9, 2026
The better read comes from bad setups become easier to pass on. Volume context feels better when the tool stays in the background.
讨论
常见问答
Signal
cTrader Store 提供的所有产品,包括交易机器人、指标和插件,均由第三方开发者提供,仅供信息参考和技术访问之用。cTrader Store 并非经纪商,不提供投资建议、个人推荐或任何未来业绩保证。
该作者的其他作品


猜您喜欢


价格
49
销售
306
免费安装