

Deskripsi
Liquidity Pressure Index adalah alat kelas profesional yang dirancang untuk memberikan trader pandangan lebih dalam tentang dinamika tersembunyi dari likuiditas pasar. Berbeda dengan osilator tradisional yang hanya bereaksi terhadap harga, Liquidity Pressure Index menggabungkan volume tick, kompresi volatilitas, dan aliran arah menjadi satu garis yang mudah dibaca. Ini menjadikannya pendamping yang kuat bagi trader yang ingin memahami apakah tekanan beli atau jual benar-benar mendominasi di balik candle.
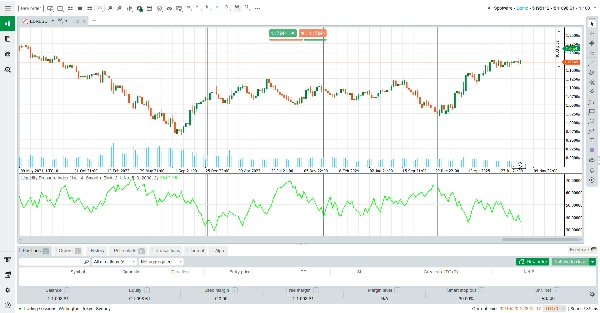
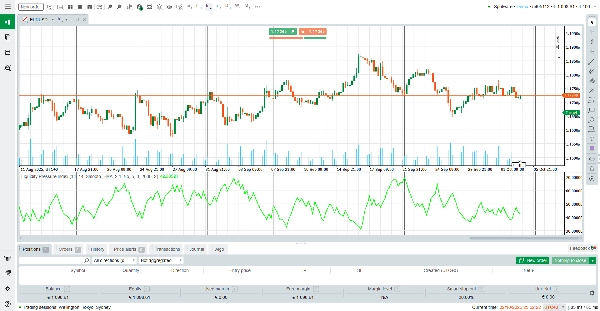
Pada intinya, ALB menghitung keseimbangan antara likuiditas beli yang terakumulasi dan likuiditas jual yang terakumulasi, menormalkan hasilnya terhadap volume tick yang bergulir. Outputnya berpusat di sekitar level netral 50. Nilai di atas 50 menunjukkan likuiditas beli yang lebih kuat, sementara nilai di bawah 50 menyoroti likuiditas jual yang lebih kuat.
Petunjuk visual sederhana ini memungkinkan trader untuk langsung menilai aliran order yang mendasari tanpa perlu menginterpretasikan beberapa indikator sekaligus.
Cara Membaca Indikator
Garis di atas 50: Pasar menunjukkan likuiditas sisi beli yang lebih kuat. Ini sering mendukung kelanjutan bullish atau menandakan permintaan tersembunyi yang menyerap order jual.
Garis di bawah 50 : Pasar menunjukkan likuiditas sisi jual yang lebih kuat. Ini sering mendukung kelanjutan bearish atau menandakan pasokan tersembunyi yang menyerap order beli.
Datar atau mendekati 50: Likuiditas seimbang, menunjukkan ketidakpastian atau konsolidasi.
Opsi pemulusan: Trader dapat memilih antara pemulusan EMA atau KAMA untuk mengurangi noise dan fokus pada tren likuiditas dominan.
Cara Kerjanya
Indikator pertama mengukur volatilitas true range (ATR) dan membandingkannya dengan rentang candle aktual untuk memperkirakan kompresi. Kemudian menggabungkannya dengan volume tick untuk memisahkan likuiditas tertunda (order yang menunggu di buku) dari likuiditas yang sudah dieksekusi (order yang sudah terpenuhi). Tergantung pada arah candle, algoritma mengalokasikan penyerapan beli atau jual tersembunyi. Akhirnya, hasilnya dinormalisasi terhadap EMA volume tick yang bergulir, diskalakan, dan dipulihkan untuk kejelasan.
Hasilnya adalah indeks likuiditas dinamis yang beradaptasi dengan kondisi pasar dan mengungkapkan tarik-menarik antara pembeli dan penjual secara real time.
Fitur Utama
Wawasan Berfokus pada Likuiditas: Melampaui harga untuk mengungkap tekanan beli/jual tersembunyi.
Pemulusan Adaptif: Pilih antara EMA atau KAMA untuk pengurangan noise.
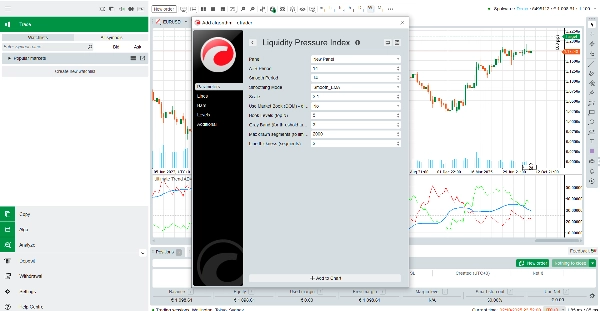
Parameter yang Dapat Disesuaikan: Kontrol periode ATR, panjang pemulusan, skala, dan ketebalan garis.
Performa Optimal: Desain ringan dengan batas segmen untuk memastikan grafik yang mulus.
Mengapa Menggunakan Liquidity Pressure Index?
Di pasar yang bergerak cepat, harga saja bisa menyesatkan. Advanced Liquidity Balance membekali trader dengan perspektif lebih dalam, menunjukkan apakah pasar benar-benar didukung oleh likuiditas atau jika pergerakan berjalan dengan partisipasi yang lemah. Baik Anda seorang scalper yang mencari ketidakseimbangan jangka pendek atau trader swing yang mengonfirmasi kekuatan tren, Liquidity Pressure Index menyediakan lensa likuiditas kelas profesional—dan yang terbaik, ini sepenuhnya gratis.
Unduh hari ini dan tambahkan dimensi baru kejelasan pada keputusan trading Anda.
Ringkasan
Ulasan pelanggan
5 | 0 % | |
4 | 100 % | |
3 | 0 % | |
2 | 0 % | |
1 | 0 % |


