
Deskripsi
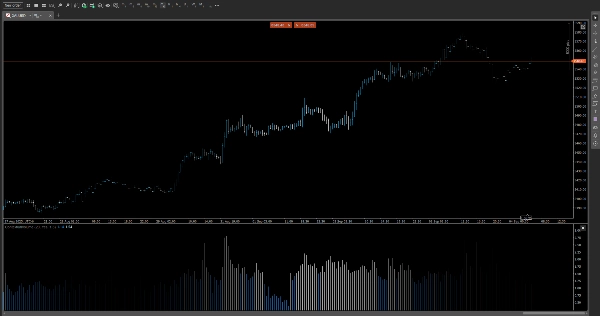
📊 Volume Relatif Intraday (RVI)
Temukan lonjakan volume yang penting—ketika itu penting.
RVI adalah indikator yang dibuat dengan presisi yang membandingkan volume saat ini dengan rata-rata historisnya pada waktu yang sama dalam sehari, mengungkap momentum tersembunyi dan pergeseran likuiditas di seluruh sesi intraday.
🔍 Fitur Utama
• Profil Volume Berdasarkan Waktu
Menghitung rata-rata volume per slot waktu (misalnya, 10:15 AM) di seluruh sesi sebelumnya, memberi Anda tolok ukur kontekstual untuk setiap candle.
• Dukungan Multi-Timeframe
Bekerja mulus dari grafik 5 menit hingga timeframe 12 jam, menyesuaikan dengan gaya trading Anda—scalping, swing, atau berbasis sesi.
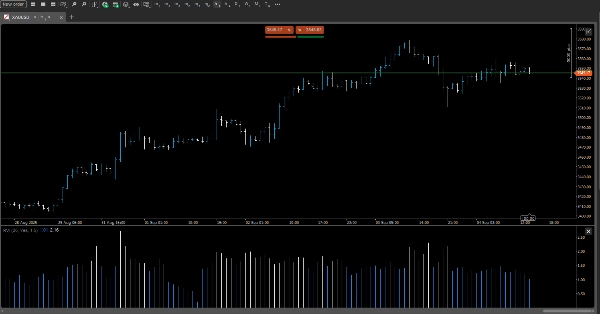
• Pengkodean Warna Dinamis
Menyoroti candle dengan volume di atas rata-rata menggunakan ambang warna yang dapat disesuaikan. Segera temukan zona aktivitas tinggi dengan petunjuk visual yang intuitif.
• Mode Rasio vs. Perbedaan
Pilih metrik yang Anda sukai:
• Mode Rasio: Menampilkan volume saat ini ÷ volume rata-rata (misalnya, 2,3×)
• Mode Perbedaan: Menampilkan deviasi absolut (misalnya, +1.200 kontrak)
• Tampilan Overlay atau Panel
Beralih antara overlay grafik inline atau panel samping yang ringkas untuk integrasi bersih dengan tata letak Anda yang sudah ada.
🎯 Kasus Penggunaan
• Konfirmasi kekuatan breakout dengan lonjakan volume relatif terhadap aktivitas tipikal
• Saring sinyal palsu selama periode volume rendah
• Identifikasi jejak institusional selama jendela intraday utama
• Tingkatkan strategi berbasis volume dengan konteks yang sadar waktu
⚙️ Opsi Kustomisasi
• Periode lookback yang dapat disesuaikan untuk rata-rata historis
• Ambang warna yang ditentukan pengguna untuk intensitas volume
• Beralih mode tampilan (Rasio/Perbedaan)
• Kompatibel dengan tema gelap/terang
Ringkasan
Ulasan pelanggan
5 | 100 % | |
4 | 0 % | |
3 | 0 % | |
2 | 0 % | |
1 | 0 % |


![Logo "[Stellar Strategies] Market Session Ultimate"](https://cdn.ctrader.com/image/webp/61ffd537-0125-4246-9e72-42eca1791d64_28232)


