
PrevDayProjection
Indikator
217 downloads
Version 1.0, Sep 2025
Windows, Mac
Beschreibung
Projektionsebenen des Vortages
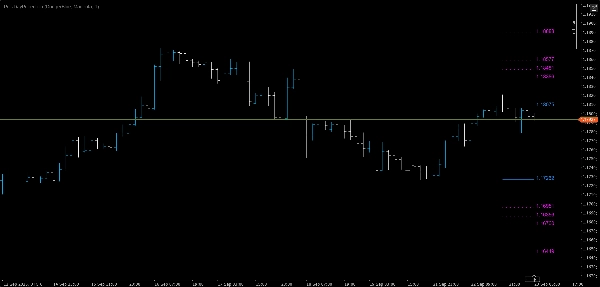
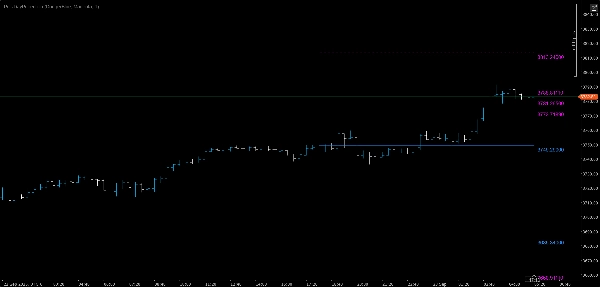
Entsperren Sie präzisen Handel mit dynamischen Fibonacci-Projektionen basierend auf der Kursbewegung von gestern.
Dieser Indikator berechnet automatisch das Hoch und Tief des Vortages, bestimmt die Spanne und projiziert dann Fibonacci-Niveaus sowohl oberhalb als auch unterhalb dieser Spanne — und bietet Ihnen so sofortige Bezugspunkte für potenzielle Unterstützungs-, Widerstands- und Ausbruchsbereiche.
Hauptmerkmale
- 📅 Automatische Erkennung von Hoch & Tief des Vortages
- 📏 Spannenbasierte Fibonacci-Projektionen auf den Niveaus 38,2 %, 50 %, 61,8 % und 100 %
- 🔼 Oberhalb des vorherigen Hochs: Vier Fibonacci-Niveaus für bullishe Fortsetzungsziele
- 🔽 Unterhalb des vorherigen Tiefs: Vier Fibonacci-Niveaus für bearishe Fortsetzungsziele
- 🎯 Nur Segmentlinien, beginnend mit der ersten Kerze des heutigen Tages — kein Durcheinander im gesamten Chart
- 🏷 Preisetiketten am rechten Rand für schnelle Übersicht
- 🎨 Anpassbare Farben und Linienstärken, passend zu Ihrem Chart-Stil
Warum Trader es lieben
- Klare Intraday-Roadmap: Wissen Sie genau, wo sich wichtige Niveaus vor Beginn der Sitzung befinden.
- Analyse in beide Richtungen: Planung für Aufwärts- und Abwärtsbewegungen.
- Zeitersparnis durch Automatisierung: Kein manuelles Zeichnen oder Neuberechnen erforderlich.
- Funktioniert auf jedem Zeitrahmen: Vom Scalping bis zum Swing-Trading.
Perfekt für
- Daytrader, die nach präzisen Ausbruchs-Zielen
- Swing-Trader, die wichtige Retracement-Zonen identifizieren
- Jeder, der Fibonacci-Niveaus als Teil seiner Strategie verwendet
💡 Tipp: Kombinieren Sie diesen Indikator mit Ihren bevorzugten Momentum- oder Volumen-Tools, um Ein- und Ausstiege rund um diese projizierten Niveaus zu bestätigen.
Zusammenfassung
KI-Zusammenfassung
PrevDayProjection is a technical indicator designed for trading platforms that automatically calculates the previous trading day’s high and low prices, determines the range, and projects Fibonacci levels based on that range. It generates key Fibonacci retracement and extension levels at 38.2%, 50%, 61.8%, and 100% both above the previous high and below the previous low. These levels serve as potential support, resistance, and breakout zones.
The indicator displays segment-only lines starting from the current day’s first bar to avoid chart clutter and includes price labels at the right edge for quick reference. Users can customize colors and line thickness to fit their chart style. It supports any timeframe, making it suitable for scalping, day trading, and swing trading.
PrevDayProjection is applicable across multiple markets including Forex, Indices, Commodities, and Crypto, with specific tags indicating symbols like EURUSD, XAUUSD (gold), and NAS100. It provides traders with a clear intraday roadmap and dual-direction analysis to plan for both bullish and bearish moves. The tool automates manual calculations, saving time and enhancing precision in identifying breakout targets and retracement zones.
Indikatorprofil
Kundenbewertungen
0.0
Bewertungen: 0
Kundenbewertungen
Bisher gibt es keine Bewertungen für dieses Produkt. Haben Sie es schon ausprobiert? Dann können Sie die erste Person sein, die andere darüber informiert!
Diskussion
Häufig gestellte Fragen (FAQ)
Forex
Indices
EURUSD
Commodities
Crypto
XAUUSD
NAS100
Über den cTrader Store verfügbare Produkte, einschließlich Handelsbots, Indikatoren und Plugins, werden von externen Entwicklern bereitgestellt und nur zu Informations- und technischen Zugriffszwecken verfügbar gemacht. cTrader Store ist kein Broker und erbringt keine Anlageberatung, persönlichen Empfehlungen oder eine Garantie für zukünftige Performance.


Preis
26
Verkäufe
2.14K
Kostenlose Installationen