
Penerangan
Salah satu kesilapan terbesar yang dilakukan oleh pedagang baru ialah mereka cuba untuk mencipta sebanyak mungkin maklumat pada carta dengan menambah terlalu banyak penunjuk dan hasilnya adalah carta yang penuh dengan bunyi dengan garis dan data yang memberikan pelbagai jenis omong kosong yang memberikan pedagang cerita yang bercanggah.
Kelebihan:
- Ketepatan luar biasa dalam mengesan pembalikan.
- Menarik secara visual dan mudah untuk melihat keadaan pasaran.
- Boleh digunakan sebagai penunjuk perdagangan trend atau penunjuk perdagangan lawan trend.
- Keputusan ujian semula yang kukuh (~95% ketepatan pada isyarat Extreme).
Kekurangan:
- Walaupun dengan keadaan Overbought "Extreme" dan Oversold "Extreme", penunjuk kadangkala boleh menyebabkan anda berdagang dalam arah bertentangan dengan trend yang sangat kuat menyebabkan kerugian besar sebelum harga akhirnya berbalik.
- Isyarat Overbought "Extreme" dan Oversold "Extreme" boleh menjadi jarang apabila berdagang pada jangka masa 15 minit dan ke atas. Untuk mengatasi ini, disyorkan untuk berdagang sekurang-kurangnya 8 pasangan utama untuk menerima isyarat Extreme dengan kerap.
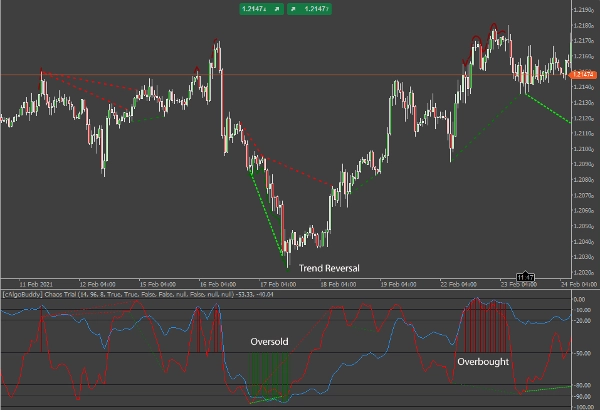
Cara menggunakan Chaos Reversals
Sistem mudah dan menang menggunakan Chaos boleh dibuat dengan menandakan garis Sokongan dan Rintangan Mingguan dan Harian dan berdagang lawan trend pada pantulan yang menghampiri garis sokongan dan rintangan tersebut menggunakan isyarat Overbought Extreme dan Oversold Extreme dari Chaos 15 minit.
Isyarat dijana seperti berikut:
- W%R pantas bergerak dahulu, diikuti oleh W%R perlahan.
- Apabila W%R pantas tunggal adalah Oversold atau Overbought, anda boleh scalping pembalikan ini.
- Apabila kedua-dua W%R pantas dan perlahan adalah Oversold atau Overbought, ini menunjukkan bahawa pasaran akan berbalik dengan jumlah yang ketara.
Penunjuk akan melukis garis merah atau hijau di atas paras rendah atau tinggi pada carta harga, serta melukis garis merah atau hijau di kawasan penunjuk untuk menandakan keadaan oversold atau overbought yang melampau. Anda boleh mematikan ini di pilihan penunjuk.
Mengesan Divergensi
Oleh kerana W%R adalah osilator, ia memberi kita peluang untuk mengesan dan berdagang divergensi. Terdapat dua jenis utama Divergensi: Biasa dan Tersembunyi.
- Divergensi biasa adalah petunjuk pembalikan arah harga.
- Divergensi tersembunyi adalah petunjuk kesinambungan arah harga.
Dalam setiap jenis utama, terdapat klasifikasi sekunder: Bearish (Negatif) dan Bullish (Positif).
- Divergensi bearish berlaku apabila penunjuk bergerak ke bawah sementara harga sama ada naik atau rata.
- Divergensi bullish berlaku apabila penunjuk bergerak ke atas sementara harga sama ada menurun atau rata.
Divergensi Biasa
Divergensi Biasa dalam istilah paling mudah adalah apabila:
- Harga membuat Highs yang lebih tinggi sementara garis W%R pantas membuat Highs yang lebih rendah: Potensi Jual.
- Harga membuat Lows yang lebih rendah sementara garis W%R pantas membuat Lows yang lebih tinggi: potensi Beli.
Dalam kedua-dua kes, pedagang mencari potensi pembalikan dalam tindakan harga.
Divergensi biasa paling baik digunakan sebagai perbandingan Swing High atau Swing Low semasa dengan Swing High atau Swing Low semasa sebelumnya. Dengan divergensi biasa, trend melemah dan sentimen pasaran telah beralih ke arah bertentangan. Pedagang boleh bersedia untuk berdagang pembalikan atau retracement yang menguntungkan.
Dalam Chaos Reversals, divergensi biasa ditunjukkan seperti berikut:
- Divergensi Biasa Bullish – Garis Hijau Cerah yang berjalur sempit.
- Divergensi Biasa Bearish – Garis Merah yang berjalur sempit
NOTA: Garis Divergensi muncul pada Pembukaan bar selepas divergensi yang disahkan.
Divergensi Tersembunyi
Divergensi Tersembunyi dalam istilah paling mudah adalah apabila:
- Garis W%R pantas membuat Lows yang lebih rendah sementara harga membuat Lows yang lebih tinggi: potensi Beli.
- Garis W%R pantas membuat Highs yang lebih tinggi sementara harga membuat Highs yang lebih rendah: potensi Jual.
Dalam kedua-dua kes, pedagang mencari potensi kesinambungan dalam tindakan harga.
Divergensi tersembunyi paling baik digunakan untuk menilai harga yang berkaitan dengan trend semasa. Selepas penarikan balik, harga sering akan meneruskan arah trend ke tahap Swing High atau Swing Low terakhir. Dengan divergensi tersembunyi, trend mungkin melemah tetapi belum selesai lagi. Seperti yang ditunjukkan di bawah, pasaran menarik balik mungkin disebabkan oleh pengambilan untung dan kelihatan untuk meneruskan trend menurun.
Dalam Chaos Reversals, divergensi tersembunyi ditunjukkan seperti berikut:
- Divergensi Tersembunyi Bearish – Garis Hijau yang berjalur luas
- Divergensi Tersembunyi Bullish – Garis Merah Gelap yang berjalur luas
Berdagang dengan Divergensi
Ini adalah nota ringkas amaran apabila berdagang dengan Divergensi. Sadarilah bahawa pasaran mungkin tidak bergerak ke arah isyarat Divergensi. Penting untuk memahami bahawa Divergensi adalah petunjuk potensi perubahan atau kesinambungan dalam arah pasaran. Penting untuk memantau pergerakan harga untuk mengesahkan arah pasaran. Juga, ambil perhatian arah keseluruhan Penunjuk Chaos, dengan membandingkan garis penunjuk dengan tahap (0 untuk overbought melampau, -100 untuk oversold melampau)
Amaran & Pemberitahuan
Isyarat yang akan dihantar adalah permulaan dan akhir Overbought/Oversold Extreme, puncak W%R perlahan dalam posisi melampau serta semua divergensi.
Amaran Telegram
Memandangkan anda mempunyai bot dan saluran yang disediakan di Telegram, penunjuk Chaos Reversals akan menghantar mesej untuk isyarat yang disahkan pada pasangan mata wang.
PENTING:
Sila pastikan Zon Masa anda diselaraskan dengan betul kepada waktu tempatan anda (sudut kanan bawah aplikasi).
Amaran Desktop
Jika anda memilih Ya, penunjuk Chaos Reversals akan menolak pemberitahuan kotak mesej pada isyarat yang disahkan pada desktop peribadi anda.
Amaran E-mel
Untuk fungsi ini berfungsi, anda mesti terlebih dahulu mengkonfigurasi cTrader anda untuk dapat menghantar e-mel (Tetapan-> E-mel).
Ringkasan
Ulasan pelanggan
5 | 100 % | |
4 | 0 % | |
3 | 0 % | |
2 | 0 % | |
1 | 0 % |


