
Deskripsi
Cara terbaik untuk memikirkan Indeks Komposit sebagaimana diterapkan pada RSI adalah dengan menganggap RSI seperti Windows 3.0 dan Indeks Komposit seperti Windows 10. Constance Brown menemukan bahwa RSI, meskipun memang membuat dan mendeteksi divergensi, tidak seakurat yang seharusnya. Ini agak paradoks untuk dikatakan, tetapi RSI adalah indikator momentum tanpa perhitungan momentum yang melekat padanya. RSI melewatkan sejumlah besar pergerakan penting dan bahkan menghasilkan beberapa pergerakan yang buruk. Apa yang dilakukan Constance Brown dengan RSI adalah memasukkan perhitungan momentum di dalam RSI itu sendiri. Indeks ini menghilangkan batasan rentang normalisasi dalam RSI. Ini berarti tidak terikat dalam rentang 0-100.
RSI dan Indeks Komposit Bersama-sama
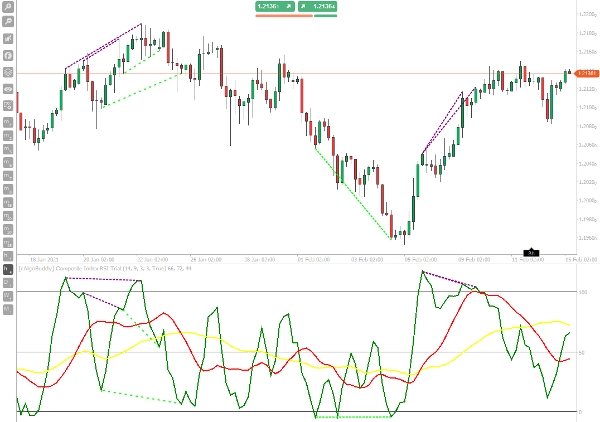
Salah satu strategi yang digunakan Constance Brown dengan Indeks Komposit adalah membandingkan Indeks Komposit dengan RSI. Ketika kita mencari divergensi, kita mencari hal-hal seperti divergensi bullish. Divergensi bullish terjadi ketika harga menciptakan titik tertinggi yang lebih tinggi, tetapi osilator menunjukkan titik tertinggi yang lebih rendah. Ketika kita menggunakan RSI dan Indeks Komposit bersama-sama, kita memperlakukan RSI seperti grafik harga dan Indeks Komposit sebagai osilator.
Indikator ini memiliki garis RSI normal internal untuk mendeteksi divergensi, jadi pekerjaan sudah dilakukan untuk Anda. Perdagangkan sinyal divergensi seperti yang Anda lakukan dengan osilator lainnya.
Fitur utama dari Indeks Komposit adalah untuk merepresentasikan momentum dengan sinyal operasi yang jelas. Jadi, ketika RSI memasuki zona jenuh beli atau jenuh jual, persilangan Indeks Komposit dengan rata-rata bergeraknya ke arah berlawanan merupakan sinyal perdagangan yang baik, kemudian, dengan menggabungkan simbiosis momentum osilator dengan aksi harga pada level support dan resistance, Anda mendapatkan logika perdagangan yang sangat menarik dan menguntungkan, yang juga sangat cocok untuk perdagangan dengan cryptocurrency.
Cara Menggunakan
Strategi Indeks Komposit adalah strategi aksi harga momentum yang didasarkan pada kombinasi level support dan resistance dengan level jenuh beli dan jenuh jual dari Relative Strength Index dan Indeks Komposit. Indeks Komposit dalam strategi perdagangan ini juga merupakan waktu masuk akhir.
Kerangka Waktu: H1+, Selalu gunakan ini dengan RSI.
Beli
- Harga memantul pada support.
- Rata-rata Bergerak RSI Komposit berada di bawah level 50 dan MA cepat (Merah) lebih rendah dari MA lambat (kuning).
- RSI membuat titik rendah dan nilainya mendekati atau di bawah 30 dan juga Indeks Komposit memiliki titik rendah.
- Kita masuk posisi beli saat Indeks Komposit melintasi ke atas rata-rata bergerak.
Jual
- Harga memantul pada resistance.
- Rata-rata Bergerak Komposit berada di atas level 50 dan MA cepat (Merah) lebih tinggi dari MA lambat (kuning)
- RSI memiliki puncak dan nilainya mendekati atau di atas 70 dan juga Indeks Komposit memiliki puncak.
- Kita masuk posisi jual saat Indeks Komposit melintasi ke bawah rata-rata bergerak (ini adalah waktu untuk masuk pasar).
Ringkasan
Ulasan pelanggan
5 | 0 % | |
4 | 100 % | |
3 | 0 % | |
2 | 0 % | |
1 | 0 % |


