
Dynamic Trend Flux
Indikator
Versi 1.0, Nov 2025
Windows, Mac
4.0
Ulasan: 1
Deskripsi
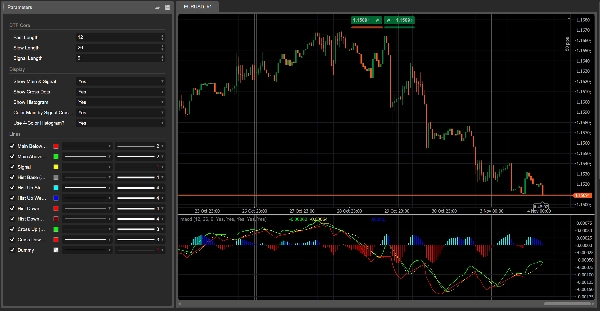
Dynamic Trend Flux
Tipe: Osilator momentum / tren (gaya MACD, multi-warna)
Apa yang dilakukannya
Dynamic Trend Flux adalah osilator momentum berwarna yang didasarkan pada perbedaan EMA cepat/lambat klasik ditambah garis sinyal.
Ini membantu Anda melihat sekilas:
- kapan momentum sedang bullish atau bearish,
- apakah momentum menguat atau melemah,
- dan di mana pergeseran tren terjadi (persilangan garis utama vs garis sinyal).
Indikator menggambar:
- Garis utama (Garis Flux)
-
- dibangun dari perbedaan antara EMA cepat dan lambat
- mengubah warna tergantung apakah di atas atau di bawah garis sinyal (opsional).
- Garis sinyal
-
- rata-rata bergerak dari garis utama, digunakan sebagai pemicu yang lebih halus.
- Histogram dengan 4 warna (opsional)
-
- menampilkan jarak antara garis utama dan sinyal,
- warna mengkodekan baik arah (di atas/di bawah nol) dan perubahan kekuatan dari bar ke bar.
- Titik pada persilangan (opsional)
-
- menyoroti di mana garis utama memotong garis sinyal → potensi perubahan fase tren.
Semua perhitungan dilakukan pada timeframe grafik saat ini.
Cara membacanya
1. Garis nol
- Nilai di atas nol → tekanan bullish mendominasi.
- Nilai di bawah nol → tekanan bearish mendominasi.
2. Histogram berwarna
Dengan mode 4 warna AKTIF:
- Aqua → di atas nol dan naik
-
- momentum bullish yang kuat / meningkat.
- Biru → di atas nol tapi turun
-
- tren bullish masih berlangsung, tetapi momentum melambat.
- Merah → di bawah nol dan turun
-
- momentum bearish yang kuat / meningkat.
- Marun → di bawah nol tapi naik
-
- fase bearish masih berlangsung, tetapi momentum kehilangan kekuatan.
Ini membuat divergensi dan pergeseran momentum jauh lebih mudah untuk dilihat secara visual.
3. Garis Utama & Sinyal
- Garis utama di atas Sinyal → fase bullish.
- Garis utama di bawah Sinyal → fase bearish.
Jika perubahan warna diaktifkan:
- Garis utama Lime = di atas Sinyal (kontrol bullish)
- Garis utama Merah = di bawah Sinyal (kontrol bearish)
4. Titik persilangan
- Titik hijau (Cross Up) → garis utama memotong di atas sinyal
-
- kemungkinan awal dari ayunan bullish.
- Titik merah (Cross Down) → garis utama memotong di bawah sinyal
-
- kemungkinan awal dari ayunan bearish.
Selalu gabungkan sinyal ini dengan struktur / aksi harga dan konteks timeframe yang lebih tinggi.
Parameter (Bahasa Inggris)
DTF Core
- Panjang Cepat – periode EMA cepat (default 12).
- Panjang Lambat – periode EMA lambat (default 26).
- Panjang Sinyal – periode SMA sinyal yang diterapkan pada garis utama (default 9).
Tampilan
- Tampilkan Garis Utama & Sinyal – mengalihkan kedua garis.
- Tampilkan Titik Persilangan – menampilkan titik pada persilangan utama/sinyal.
- Tampilkan Histogram – mengalihkan histogram di belakang.
- Warnai Garis Utama berdasarkan Persilangan Sinyal?
-
- AKTIF → garis utama Lime di atas sinyal, Merah di bawah.
- MATI → garis utama tetap Merah.
- Gunakan Histogram 4 Warna?
-
- AKTIF → logika aqua / biru / merah / marun.
- MATI → histogram berwarna abu-abu tunggal.
Ringkasan
Profil indikator
Ulasan pelanggan
4.0
Ulasan: 1
5 | 0 % | |
4 | 100 % | |
3 | 0 % | |
2 | 0 % | |
1 | 0 % |
Diskusi
Pertanyaan umum
Signal
Indices
Commodities
GBPUSD
RSI
Bollinger
Fibonacci
Scalping
AI
XAUUSD
NAS100
MACD
BTCUSD
Forex
Breakout
EURUSD
NZDUSD
Martingale
Prop
ZigZag
Supertrend
Fair Value Gap
SMC
Crypto
Grid
Stocks
ATR
USDJPY
VWAP
Produk-produk yang tersedia melalui cTrader Store, termasuk bot trading, indikator, dan plugin, disediakan oleh pengembang pihak ketiga serta hanya ditujukan untuk akses teknis dan informasi. cTrader Store bukan broker dan tidak menyediakan saran investasi, rekomendasi pribadi, atau jaminan apa pun tentang kinerja di masa mendatang.


Harga
42.11M
Volume trading
6.13M
Pip dimenangkan
222
Penjualan
8.39K
Instal gratis