
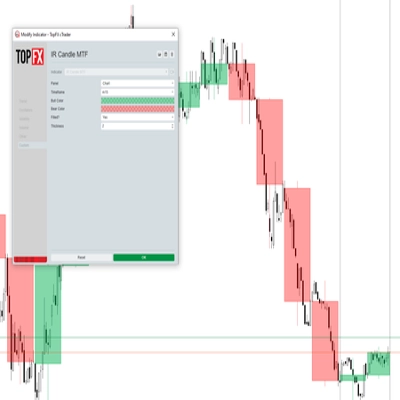
IR Candle MTF
Indicator
2.17K downloads
Version 1.0, Jan 2025
Windows, Mac
4.6
Reviews: 6
5.7K
Free installs
Description
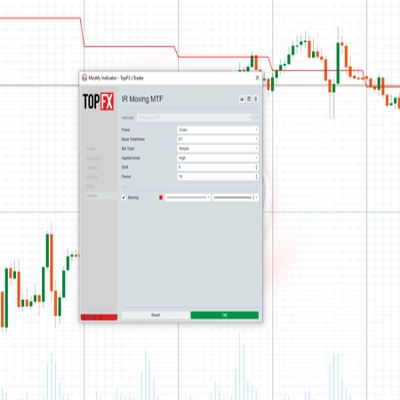
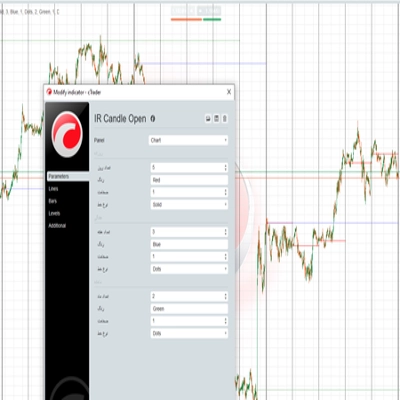
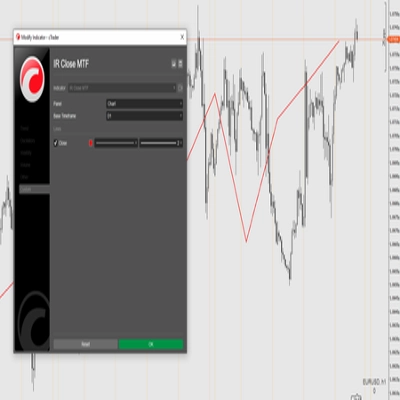
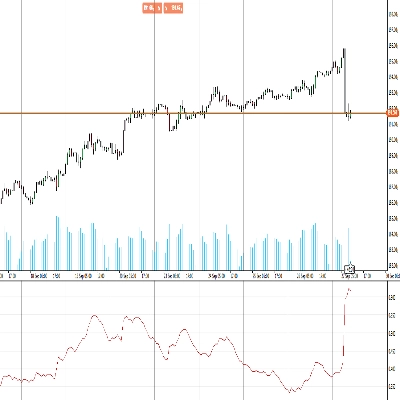
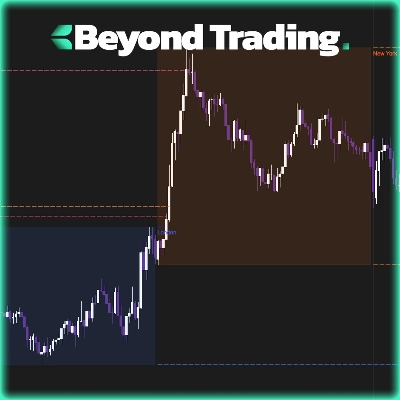
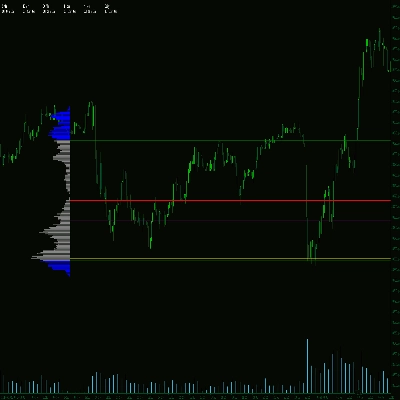
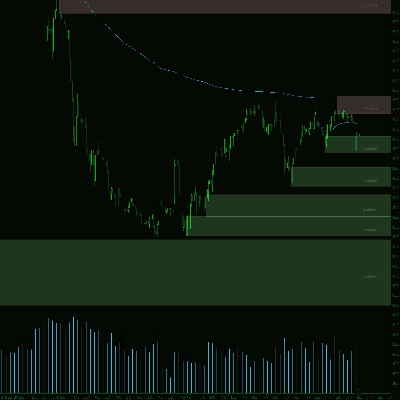
with this indicator you could see other time frame candle in your chart.
Summary
AI summary
IR Candle MTF is a trading indicator that allows users to view candlestick data from different time frames directly on their current chart. This functionality enables traders to analyze multiple time frames simultaneously without switching charts, facilitating a more comprehensive market overview. The indicator integrates seamlessly into existing charts, displaying higher or lower time frame candles overlaid on the active chart timeframe. It supports various time frames as per user needs, enhancing multi-time frame analysis for improved decision-making.
Indicator profile
Discussion
Customer reviews
4.6
Reviews: 6
5 | 67 % | |
4 | 33 % | |
3 | 0 % | |
2 | 0 % | |
1 | 0 % |
Customer reviews
July 9, 2025
Pros: Displays higher timeframe candles on lower charts. Clear visualization, easy setup, useful for multi-timeframe analysis. Cons: No tooltips or OHLC data on candles. Can't save templates. Lacks filtering by candle patterns or integrated alerts.
July 3, 2025
July 3, 2025
or if the thickness of the wick could be increased without emphasizing the outline of the candle.

April 14, 2025
I had tried creating something similar previously but yours is better, I would suggest adding an option to have an outer box act as a candle wick to make it easy on the eyes
FAQ
Products available through cTrader Store, including trading bots, indicators and plugins, are provided by third-party developers and made available for informational and technical access purposes only. cTrader Store is not a broker and does not provide investment advice, personal recommendations or any guarantee of future performance.




Price
5.7K
Free installs