
Daily Open Color Zones
インジケーター
346 ダウンロード数
バージョン 1.0、Sep 2025
Windows、Mac
4.0
レビュー: 1
説明
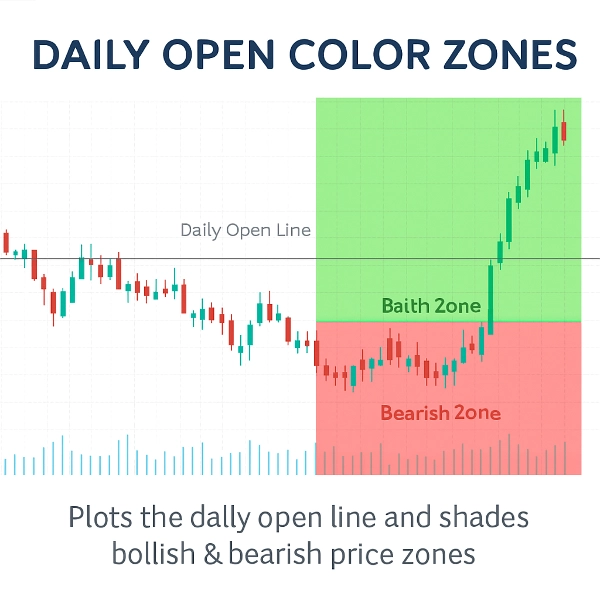
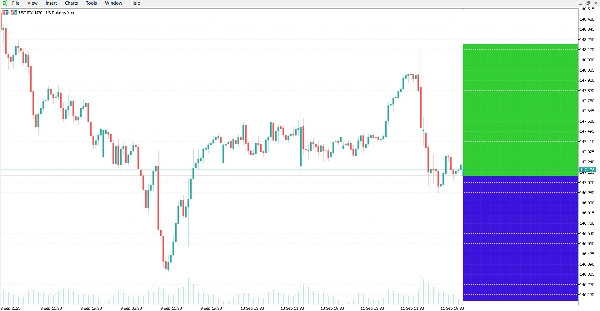
このインジケーターは、日次オープンラインをプロットし、その周囲の強気および弱気の価格ゾーンをシェード表示します。
日次オープンの上か下で市場が取引されているかを明確に視覚的に示し、これは日中分析で一般的に使用されるレベルです。
インジケーターは自動的に日次オープン価格に水平線を描画し、チャートの領域をハイライトします:
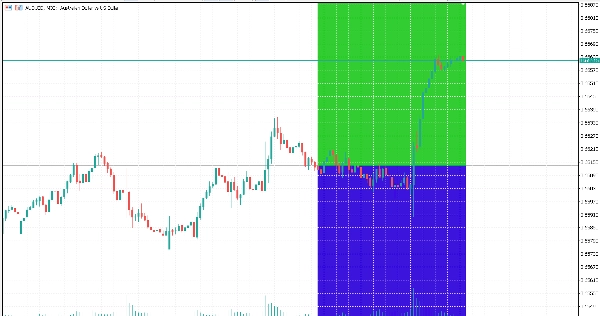
- ラインの上の緑色ゾーン(強気エリア)。
- ラインの下の赤色ゾーン(弱気エリア)。
特徴:
- 自動日次オープンライン:日次オープン価格を正確にプロット。
- カラ―ゾーン:カスタマイズ可能な色で強気および弱気のエリアを簡単に識別。
- 動的更新:新しいローソク足ごとにゾーンが自動調整。
- カスタマイズ可能な外観:ラインスタイル、太さ、ゾーンの色を変更可能。
- 軽量かつ効率的:CPU使用率を最小限に抑える設計。
- すべてのシンボルと時間枠で動作。
結論:
このインジケーターは、日次オープンと関連する強気/弱気ゾーンの明確なチャート視覚化を提供します。異なる市場や時間枠でのテクニカル分析に適用可能です。
概要
AIによる概要
The Daily Open Color Zones indicator visually marks the daily open price on trading charts by automatically plotting a horizontal line at this level. It shades the price area above the daily open line in green to indicate bullish zones and the area below in red to indicate bearish zones. These color-coded zones update dynamically with each new candle, providing real-time visual cues about market direction relative to the daily open. The indicator supports all symbols and timeframes, making it applicable across various markets including Forex, cryptocurrencies, and commodities like gold (XAUUSD). Users can customize the line style, thickness, and zone colors to suit their preferences. Designed to be lightweight, it minimizes CPU usage while offering clear intraday reference points commonly used in technical analysis and scalping strategies.
インジケーターのプロフィール
カスタマーレビュー
4.0
レビュー: 1
5 | 0 % | |
4 | 100 % | |
3 | 0 % | |
2 | 0 % | |
1 | 0 % |
カスタマーレビュー
October 20, 2025
Clean and visual 🎨 - Daily Open Zones make trend bias crystal clear. Great tool for intraday planning and momentum entries!
ディスカッション
よくあるご質問
Forex
Scalping
EURUSD
Crypto
Grid
XAUUSD
cTrader Storeで入手可能な取引ボット、インジケーター、プラグインなどの商品は、第三者の開発者が提供するものであり、情報と技術の取得のみを目的としてご利用いただけます。cTrader Storeはブローカーではなく、投資助言や個人的な推奨を行うことも、将来のパフォーマンスを保証することもありません。
この作成者の他の商品


価格
登録日 13/09/2025
27
販売
5.4K
無料インストール