Opis
Panel Informacji o Świecach: Natychmiastowe, konfigurowalne informacje po najechaniu na dowolną świecę
Przegląd
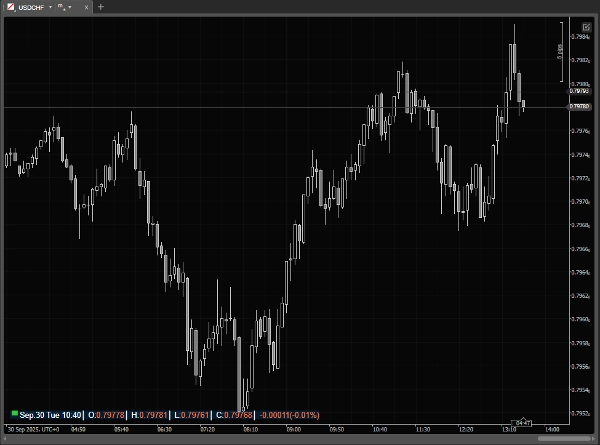
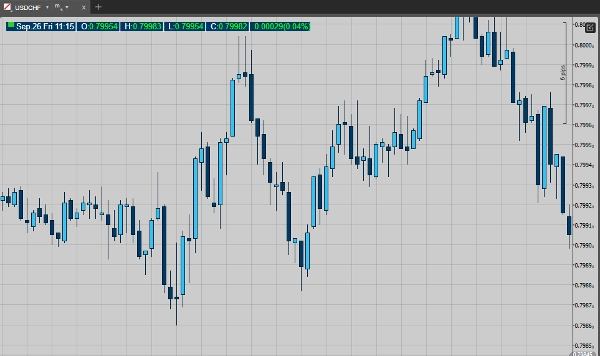
Panel Informacji o Świecach to lekka nakładka cTrader, która daje Ci natychmiastowe, precyzyjne informacje o dowolnej świecy na wykresie. Gdy mysz znajduje się poza wykresem, pokazuje kompaktową linię statusu z aktualną sesją rynkową oraz czasem serwera/lokalnym/UTC.
cTrader już dostarcza informacje o świecach, ale tylko w głównym pasku statusu świecy - co oznacza, że nie jest widoczny podczas korzystania z oddzielnych wykresów. Nie można go też dostosować, a mała czcionka często utrudnia szybkie odczytanie. Panel Informacji o Świecach rozwiązuje te problemy, wprowadzając czytelną, w pełni konfigurowalną nakładkę bezpośrednio na wykres.
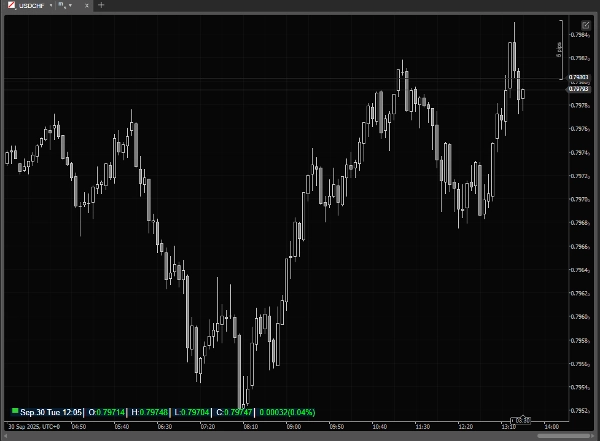
Przesuń mysz nad świecami, a panel się rozwinie, pokazując datę, czas, otwarcie, maksimum, minimum, zamknięcie, wolumen ticków oraz (opcjonalnie) procentową zmianę względem poprzedniej świecy. Wszystkie elementy wizualne i układ są konfigurowalne, dzięki czemu panel dopasowuje się do Twojego stylu pracy i motywu wykresu.
Kluczowe cechy
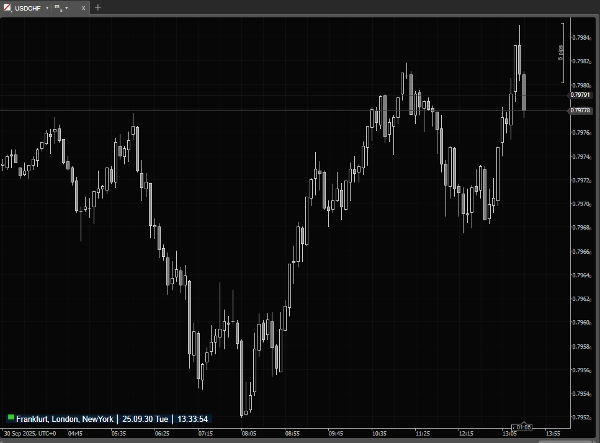
· Wskaźnik sesji rynkowej + aktualny znacznik czasu (Lokalny / Serwer / UTC).
· Panel po najechaniu pokazujący datę, czas, O/H/L/C oraz wolumen ticków świecy, na którą najedziono.
· Opcjonalny wyświetlacz procentowej zmiany (bieżąca vs poprzednia świeca).
· Dwa tryby wyświetlania: kompaktowy (mysz poza wykresem) i szczegółowy (mysz nad wykresem).
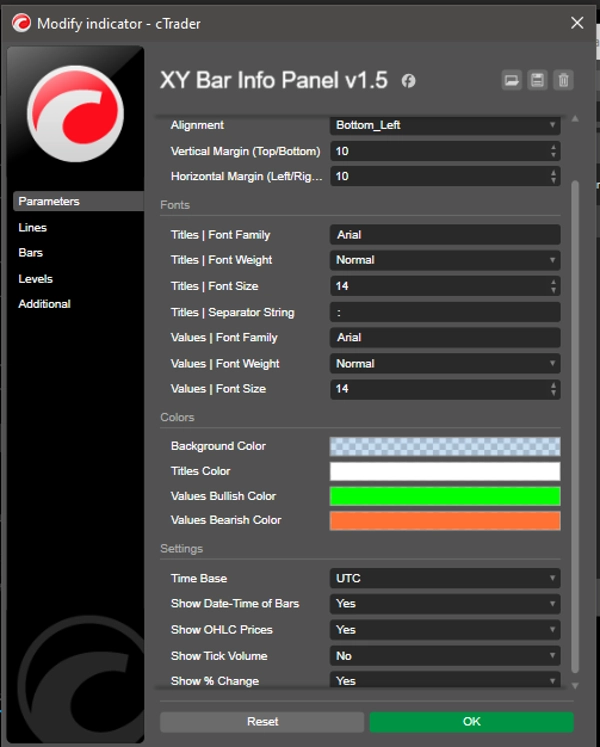
· Dziewięć opcji umiejscowienia + marginesy pikselowe dla przesunięć pionowych i poziomych.
· Oddzielne sterowanie czcionkami dla tytułów (etykiet) i wartości (rodzina, grubość, rozmiar).
· Separator tytułów dla kompaktowego oznaczania.
· Konfigurowalne kolory: tło panelu, kolor tytułu, kolory wartości wzrostowych (byczych) i spadkowych (niedźwiedzich).
Zastosowania
· Szybki odczyt dokładnych wartości OHLC i znacznika czasu dla dowolnej świecy historycznej lub na żywo bez ręcznego używania krzyża.
· Sprawdzanie wolumenu ticków i procentowej zmiany podczas analizy ruchu cen.
· Monitorowanie statusu sesji rynkowej oraz czasu serwera/lokalnego/UTC na pierwszy rzut oka.
· Przygotowywanie zrzutów ekranu wykresów lub materiałów edukacyjnych z jednolitymi, czytelnymi danymi świec.
· ...
Dlaczego traderzy to polubią
W przeciwieństwie do wbudowanego paska statusu cTrader (który jest umieszczony na stałe na dole głównego okna, znika w oddzielnych wykresach i używa małych, niekonfigurowalnych czcionek), Panel Informacji o Świecach jest zawsze widoczny tam, gdzie chcesz, z czytelnymi czcionkami, kolorami i układem. Oszczędza czas w porównaniu z ręcznym odczytywaniem paska statusu lub wartości krzyża, utrzymuje wykres w czystości i dostarcza dokładnie tych informacji, których potrzebujesz na pierwszy rzut oka. Lekki i responsywny, został zaprojektowany do codziennego użytku bez spowalniania platformy.
Podsumowanie
Opinie klientów
5 | 100 % | |
4 | 0 % | |
3 | 0 % | |
2 | 0 % | |
1 | 0 % |