

説明
Liquidity Pressure Indexは、市場の流動性の隠れたダイナミクスをトレーダーに深く理解させるために設計されたプロフェッショナルグレードのツールです。価格にのみ反応する従来のオシレーターとは異なり、Liquidity Pressure Indexはティックボリューム、ボラティリティ圧縮、方向性フローを一つの読みやすいラインに融合させています。これにより、ローソク足の背後で買い圧力または売り圧力が本当に支配的かどうかを理解したいトレーダーにとって強力なパートナーとなります。
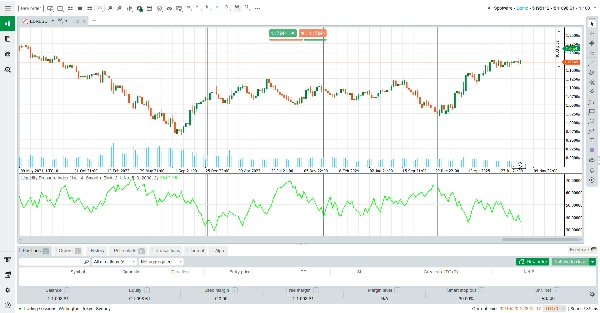
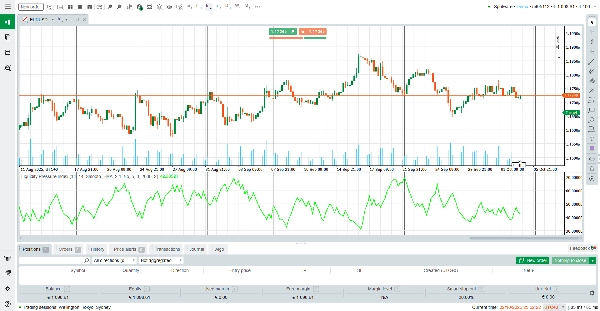
基本的に、ALBは蓄積された買い流動性と蓄積された売り流動性のバランスを計算し、その結果をローリングティックボリュームに対して正規化します。出力は中立レベルの50を中心にしています。50を超える値はより強い買い流動性を示し、50未満の値はより強い売り流動性を示します。
このシンプルな視覚的手がかりにより、トレーダーは複数の指標を一度に解釈する必要なく、基礎となる注文フローを即座に把握できます。
インジケーターの読み方
50以上のライン:市場はより強い買い側流動性を示します。これはしばしば強気の継続を支持したり、売り注文を吸収する隠れた需要を示唆します。
50未満のライン:市場はより強い売り側流動性を示します。これはしばしば弱気の継続を支持したり、買い注文を吸収する隠れた供給を示唆します。
50付近またはフラット:流動性は均衡しており、迷いまたは統合を示唆します。
スムージングオプション:トレーダーはノイズを減らし、支配的な流動性トレンドに集中するためにEMAまたはKAMAスムージングを選択できます。
仕組み
このインジケーターはまず真のレンジのボラティリティ(ATR)を測定し、実際のローソク足のレンジと比較して圧縮を推定します。次にこれをティックボリュームと組み合わせて、保留中の流動性(注文帳に待機中の注文)と実行済みの流動性(既に約定した注文)を分離します。ローソク足の方向に応じて、アルゴリズムは隠れた買いまたは売りの吸収を割り当てます。最後に、結果はローリングEMAのティックボリュームに対して正規化され、スケーリングされ、明瞭さのためにスムーズ化されます。
結果は市場状況に適応し、リアルタイムで買い手と売り手の綱引きを明らかにする動的な流動性指数です。
主な特徴
流動性に焦点を当てた洞察:価格を超えて隠れた買い/売り圧力を明らかにします。
適応型スムージング:ノイズ低減のためにEMAまたはKAMAを選択可能。
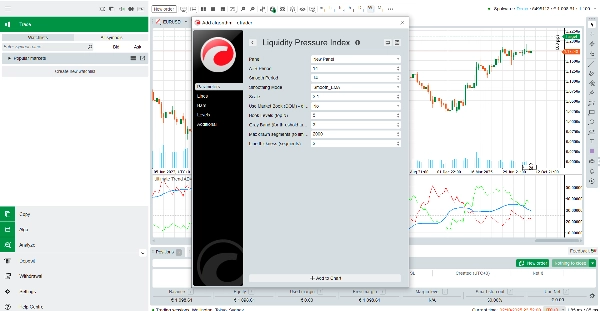
カスタマイズ可能なパラメーター:ATR期間、スムージング長、スケール、ラインの太さを制御可能。
最適化されたパフォーマンス:スムーズなチャート表示を保証するセグメント制限を備えた軽量設計。
なぜLiquidity Pressure Indexを使うのか?
急速に動く市場では、価格だけでは誤解を招くことがあります。Advanced Liquidity Balanceは、トレーダーに市場が本当に流動性によって支えられているか、あるいは動きが弱い参加で進んでいるかを示すより深い視点を提供します。短期のアンバランスを探すスキャルパーであれ、トレンドの強さを確認するスイングトレーダーであれ、Liquidity Pressure Indexはプロフェッショナルグレードの流動性レンズを提供し、しかも完全に無料です。
今すぐダウンロードして、あなたのトレーディングの意思決定に新たな明瞭さの次元を加えましょう。
概要
カスタマーレビュー
5 | 0 % | |
4 | 100 % | |
3 | 0 % | |
2 | 0 % | |
1 | 0 % |


![「[Stellar Strategies] Smart ADX」ロゴ](https://cdn.ctrader.com/image/webp/af13b084-b6f6-41db-b7bc-c7e688b57b05_36929)


![「[Stellar Strategies] MARSI Signal Plotter」ロゴ](https://cdn.ctrader.com/image/webp/7b2b8da6-8f8e-4646-8d4a-4710c516c01e_25567)


