説明
BullBear Dynamics — cTrader用のトレンド&モメンタムインジケーター
BullBear Dynamicsは、cTraderプラットフォーム向けに設計された堅牢でボラティリティ対応のインジケーターで、市場における強気と弱気のモメンタムのバランスを検出・解釈するのに役立ちます。移動平均、ATR正規化、動的閾値を組み合わせて、トレンド評価のための正確で視覚的に直感的なツールを提供します。
方法論と内部ロジック
このインジケーターは、短期EMAと長期EMAの2つの指数移動平均を計算します。
次に、これらのEMAの差を取り、平均真の範囲(ATR)で割ります。この正規化により、現在の市場のボラティリティに応じてモメンタム信号を調整します。
正規化された値に適用されるEMAであるシグナルラインは、ノイズをフィルタリングし、小さな変動を平滑化します。
弱い動きと強い動きを区別するために、このツールはルックバックウィンドウ内のローリング標準偏差(StdDev)を計算し、それに係数を掛けて上下の閾値を定義します。
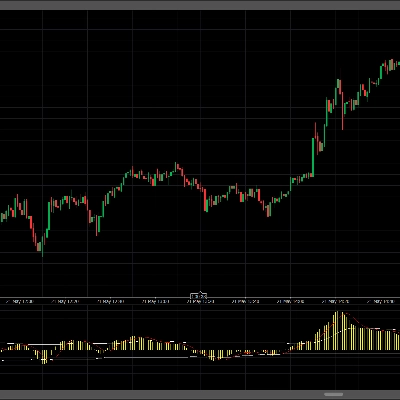
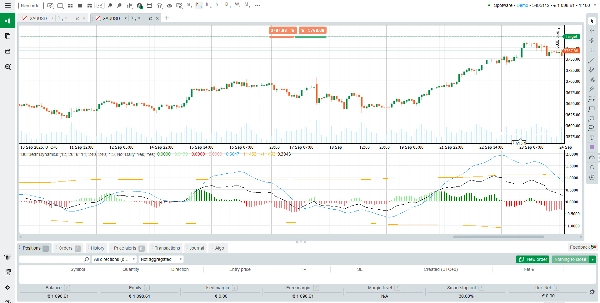
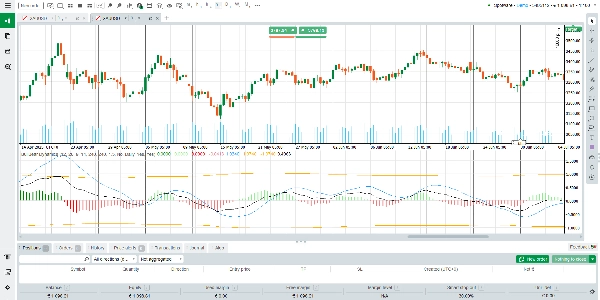
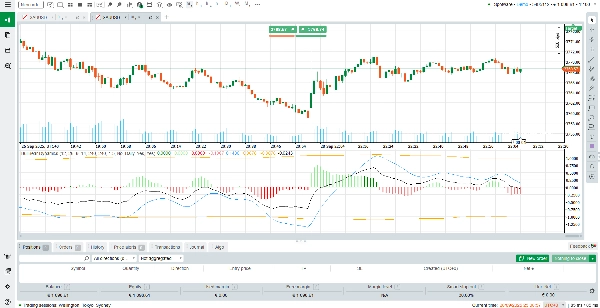
最終的な出力は、複数の色状態を持つヒストグラムとシグナルラインおよび閾値境界として視覚化されます。
出力の読み方と解釈
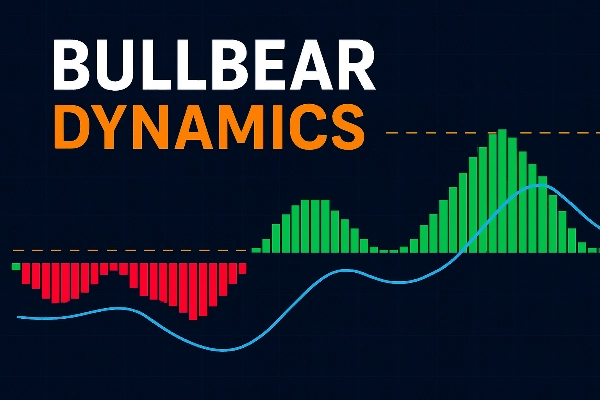
ヒストグラムバー(緑/赤):
• 緑は強気のモメンタムを示し、赤は弱気のモメンタムを示します。
• 強い色(より明るいまたは濃い)はヒストグラムが閾値を超えていることを意味し、強い動きを示唆します。
• 弱い色はヒストグラムが閾値の範囲内に留まっていることを意味し、穏やかなモメンタムまたはノイズを示唆します。
シグナルライン:
• 参照基準線として機能します。
• ヒストグラムがシグナルラインを上回ると、強気モメンタムの強化の可能性を示します。
• 下回ると、弱気モメンタムの強化の可能性を示します。
閾値ライン(上限&下限):
• これらの破線は重要なゾーンを定義します。
• ヒストグラムバーが閾値を超えると、強く高信頼のモメンタムの動きを示します。
• 閾値内に留まるバーはレンジまたは迷いを示し、信号の信頼性が低くなります。
シナリオと読み取り:
強気モメンタム — シグナルライン上の緑バー、できれば上限閾値も超える。
弱気モメンタム — シグナルライン下の赤バー、できれば下限閾値も超える。
中立/レンジ — バーは閾値内で振動し、色が交互に変わり、小さい振幅。
モメンタムの変化または反転 — ヒストグラムがシグナルラインを横切り、色が変わる。閾値も破る場合は信頼性が高まる。
使用の提案とベストプラクティス
BullBear Dynamicsは他のツール(トレンドフィルター、サポート/レジスタンス、パターン分析)と組み合わせて使用し、確認に役立ててください。
ヒストグラムバーが閾値内にある低ボラティリティ期間中の信号の解釈には注意してください。
ヒストグラムがシグナルラインを横切り、閾値を破る信号を優先してください。
低い時間枠の信号に基づいて行動する前に、高い時間枠で方向性の整合性を確認してください。
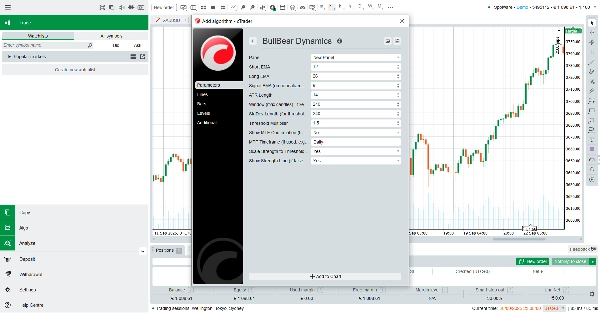
パラメーター(EMAの長さ、閾値乗数、StdDevウィンドウ)を調整して、異なる市場(外国為替、株価指数、商品、暗号通貨)に適合させてください。
主な特徴とハイライト
ボラティリティ適応型正規化 — モメンタムはATRでスケーリングされ、市場環境の変化にわたって信号の信頼性が向上します。
動的閾値 — ローリング標準偏差から構築され、市場の現状に適応し、誤ったブレイクを減らすのに役立ちます。
明確な多色ヒストグラム — 強いモメンタムと弱いモメンタム、強気と弱気の視覚的区別。
幅広い互換性 — cTraderがサポートするすべての銘柄と時間枠で動作します。
無料で使用可能 — コストなしで利用でき、サブスクリプションなしで高度なインジケーター機能を求めるトレーダーに最適です。
概要
The output is displayed as a multi-color histogram with green bars indicating bullish momentum and red bars indicating bearish momentum. The intensity of the colors reflects the strength of the momentum relative to dynamically calculated upper and lower thresholds. The signal line serves as a baseline to identify potential momentum shifts when the histogram crosses it. Threshold lines mark zones of significant momentum moves, with bars crossing these lines signaling stronger trends.
BullBear Dynamics supports all instruments and timeframes available on cTrader, including Forex, commodities, indices, and cryptocurrencies. It is recommended to use this indicator alongside other analysis tools for confirmation and to adjust its parameters to fit different market conditions and trading styles such as scalping.
カスタマーレビュー
5 | 100 % | |
4 | 0 % | |
3 | 0 % | |
2 | 0 % | |
1 | 0 % |