
Reactive Moving Average
インジケーター
260 ダウンロード数
バージョン 1.0、Jan 2025
Windows、Mac
5.0
レビュー: 1
説明
📈 シグナル移動平均 📉
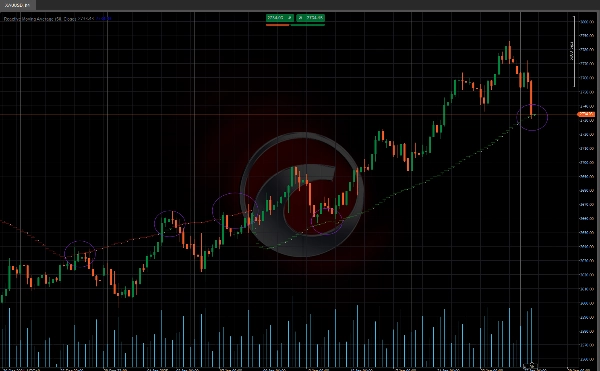
この シグナル移動平均 は、単純移動平均(SMA)と動的な相関計算を組み合わせて、市場の状況により適応するインジケーターです。🎯 このインジケーターはトレンドの強さに基づいて感度を調整し、トレンドの識別や市場ノイズの除去に強力なツールとなります。🌟
主な特徴 🔑
📊 調整移動平均:
- 移動平均線は価格と時間の相関に基づいて動的に調整されます。
- 強いトレンド市場では、移動平均は価格に追従するためにより速く動きます。🚀
- 横ばい市場では、移動平均はより安定し、誤ったシグナルを減らします。🛑
🔢 相関計算:
- インジケーターは価格と時間の相関を ピアソンの公式を使って計算します。
- 決定係数(R²)に基づいて移動平均を調整します。🧮
👀 視覚化:
- 解釈しやすい明確で直感的な表示。📉📈
インジケーターの使い方 🛠️
🔍 トレンドの識別:
- 強気トレンド: 価格が相関移動平均の上にある場合。🐂
- 弱気トレンド: 価格が相関移動平均の下にある場合。🐻
✅ シグナルの確認:
- 調整移動平均を動的なサポートまたはレジスタンスレベルとして使用します。🛡️
- 他のテクニカルツールと組み合わせてシグナルを確認します。🔄
移動平均の調整 ⚙️
アルゴリズムは R²の値に基づいて移動平均を調整します:
- R² > 0.5 の場合(有意な相関):
-
- 移動平均は現在のSMA値と調整移動平均の前の値(_ma)との加重組み合わせを使用して調整されます。
- 加重は R²の値に依存します。⚖️
- R² ≤ 0.5 の場合(有意でない相関):
-
- 移動平均は現在のSMA値と調整移動平均の前の値の絶対差に比例した値を引くことで調整されます。🔄
- Ctraderストアのインジケーター:
概要
インジケーターのプロフィール
カスタマーレビュー
5.0
レビュー: 1
5 | 100 % | |
4 | 0 % | |
3 | 0 % | |
2 | 0 % | |
1 | 0 % |
カスタマーレビュー
August 12, 2025
Pros: Adaptive moving average combining SMA with dynamic correlation to reduce lag and smooth price noise. Flexible sensitivity settings. Cons: No alerts or tooltips. No template saving. Can produce noise on low-end PCs or very short timeframes.
ディスカッション
よくあるご質問
Signal
Breakout
Supertrend
RSI
cTrader Storeで入手可能な取引ボット、インジケーター、プラグインなどの商品は、第三者の開発者が提供するものであり、情報と技術の取得のみを目的としてご利用いただけます。cTrader Storeはブローカーではなく、投資助言や個人的な推奨を行うことも、将来のパフォーマンスを保証することもありません。


価格
登録日 03/10/2024
163
販売
37.73K
無料インストール