
説明
スナイパーゾーンプロインジケーター
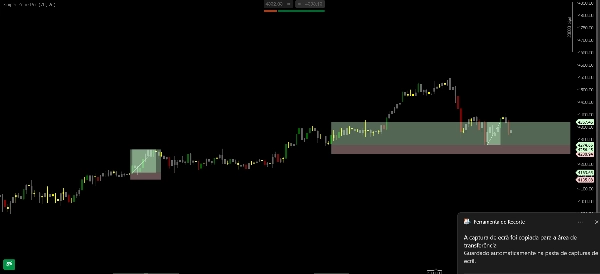
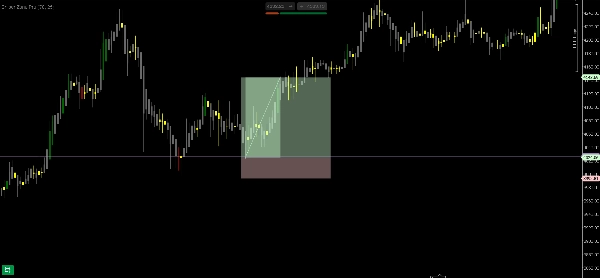
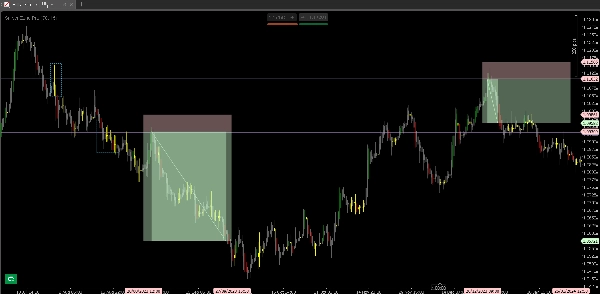
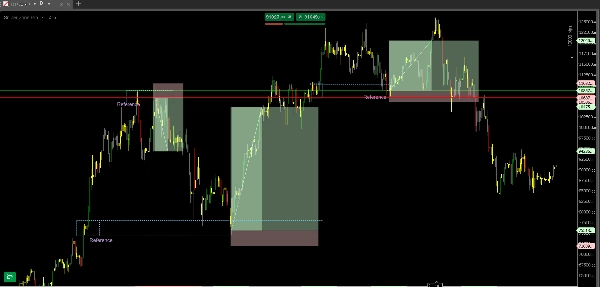
この スナイパーゾーンプロ は、大口機関の足跡を価格チャート上で視覚的に特定するために設計された高度な分析ツールです。過去の 迷いゾーン のマッピングと、操作の動きや機関の強さを明らかにするローソク足の色分けシステムを組み合わせています。このインジケーターは市場の混沌を明確な操作領域に変換し、トレーダーが価格が「戦った」場所や、新たな拡大前にテストされる傾向のある場所を正確に特定できるようにします。
スナイパーゾーンプロの主な特徴
- 「戦闘ゾーン」のマッピング: 価格がボリュームを蓄積した迷いのエリアを自動的に特定します。これらの領域は、買い手と売り手の間で重要な争いがある価格レベルを表すため、重要な「操作ゾーン」となります。
- アクティブな機関色分け: 色分けシステムは単なる美的要素ではなく、高ボリュームや吸収などの機関の動きの特徴を持つローソク足を強調し、市場のノイズと大口プレイヤーの意図を区別します。
- 高確率のテストゾーン: 重要な領域に到達すると、価格が単にゾーンをテストしているのか、それとも突破準備ができているのかを視覚化し、より正確なエントリートリガーを提供します。
- 階層フィルター(HTF): より高い時間軸での関心ゾーンを優先し、価格の戦いがより技術的に重要であり、リターンの可能性が大幅に高い場所を示します。
なぜスナイパーゾーンプロを使うのか?
- 市場の意図の読み取り: 戦闘ゾーン内のローソク足の色を観察することで、機関がそのポジションを守っているのか、放棄しているのかをトレーダーが識別できます。
- 操作ゾーンの定義: 「どこで取引するか」の疑問を排除します。インジケーターは、最良の機会は動きの途中ではなく、価格が以前に迷いを示した領域のテスト時にあることを示します。
- 主観性の削減: トレーダーはトップやボトムを「予想」するのをやめ、プロの関心が証明されたエリアに基づいて取引を開始します。
概要
AIによる概要
Sniper Zone Pro is an advanced trading indicator designed to visually identify institutional activity on price charts by mapping past indecision zones and applying a candle coloring system that highlights market manipulation and institutional strength. It automatically detects "battle zones" where price accumulated volume, marking key operational areas of buyer-seller disputes. The indicator’s color-coded candles reveal institutional movements such as high volume or absorption, helping traders distinguish significant market actions from noise. It also highlights high-probability test zones, indicating whether price is testing or ready to break through these critical levels. A hierarchy filter prioritizes zones from higher timeframes, emphasizing areas with greater technical relevance. Sniper Zone Pro supports multiple markets including Forex, cryptocurrencies, stocks, commodities, and indices, with tags referencing symbols like BTCUSD, EURUSD, GBPUSD, XAUUSD, NAS100, and USDJPY. The tool aids traders in reading market intent by showing institutional defense or abandonment of price levels, defining precise operating zones to reduce subjectivity, and focusing trading decisions on professional interest areas rather than arbitrary price points.
インジケーターのプロフィール
カスタマーレビュー
4.6
レビュー: 3
5 | 67 % | |
4 | 33 % | |
3 | 0 % | |
2 | 0 % | |
1 | 0 % |
カスタマーレビュー
January 19, 2026
The best part is random clicks become easier to catch, and a 1R exit plan makes review easier.
January 14, 2026
H1 makes the signal less noisy, and it adds a useful layer without forcing action.
January 5, 2026
No reason to yolo this live without a few normal sessions. The result needs a journal.
ディスカッション
よくあるご質問
BTCUSD
Forex
Signal
Breakout
Indices
EURUSD
Commodities
GBPUSD
NZDUSD
Scalping
Crypto
Stocks
XAUUSD
NAS100
USDJPY
cTrader Storeで入手可能な取引ボット、インジケーター、プラグインなどの商品は、第三者の開発者が提供するものであり、情報と技術の取得のみを目的としてご利用いただけます。cTrader Storeはブローカーではなく、投資助言や個人的な推奨を行うことも、将来のパフォーマンスを保証することもありません。


価格
登録日 11/07/2025
3
販売