
Daily Open Color Zones
지표
346 다운로드
버전 1.0, Sep 2025
Windows, Mac
4.0
리뷰: 1
설명
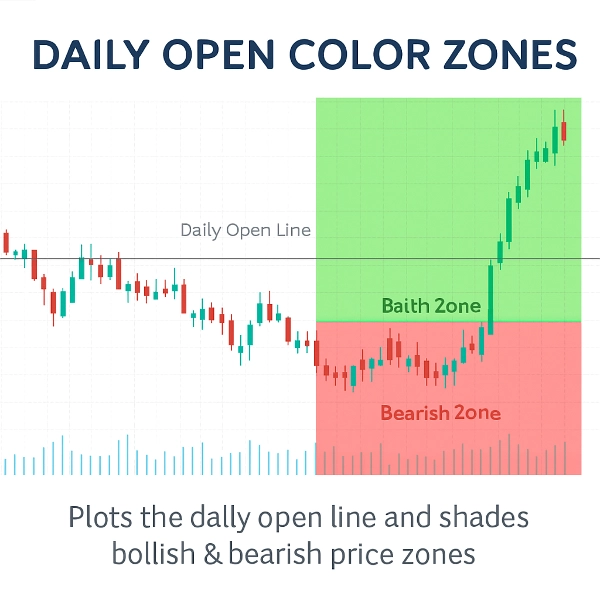
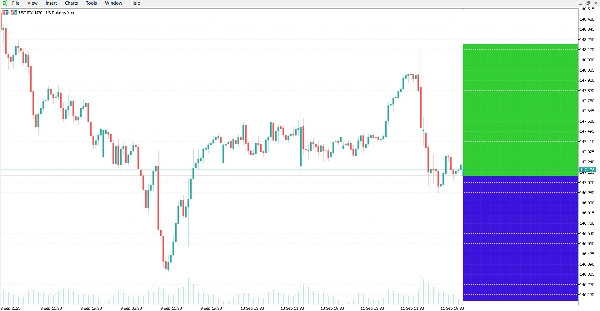
이 지표는 일간 시가선을 표시하고 그 주변의 강세 및 약세 가격 구역을 음영 처리합니다.
이는 시장이 일간 시가 위에서 거래되고 있는지 아래에서 거래되고 있는지를 명확하게 시각적으로 확인할 수 있게 해주며, 이는 일중 분석에서 일반적으로 사용되는 수준입니다.
이 지표는 자동으로 일간 시가 가격에 수평선을 그리고 차트 영역을 강조 표시합니다:
- 선 위의 녹색 구역 (강세 구역).
- 선 아래의 빨간 구역 (약세 구역).
특징:
- 자동 일간 시가선: 일간 시가 가격을 정확하게 표시합니다.
- 색상 구역: 사용자 지정 가능한 색상으로 강세 및 약세 구역을 쉽게 구분할 수 있습니다.
- 동적 업데이트: 각 새로운 캔들마다 구역이 자동으로 조정됩니다.
- 사용자 지정 가능한 외관: 선 스타일, 두께 및 구역 색상을 수정할 수 있습니다.
- 경량 및 효율적: 최소한의 CPU 사용을 위해 설계되었습니다.
- 모든 심볼과 시간 프레임에서 작동합니다.
결론:
이 지표는 일간 시가와 관련된 강세/약세 구역을 명확하게 차트에 시각화해줍니다. 기술적 분석을 위해 다양한 시장과 시간 프레임에 적용할 수 있습니다.
요약
AI 요약
The Daily Open Color Zones indicator visually marks the daily open price on trading charts by automatically plotting a horizontal line at this level. It shades the price area above the daily open line in green to indicate bullish zones and the area below in red to indicate bearish zones. These color-coded zones update dynamically with each new candle, providing real-time visual cues about market direction relative to the daily open. The indicator supports all symbols and timeframes, making it applicable across various markets including Forex, cryptocurrencies, and commodities like gold (XAUUSD). Users can customize the line style, thickness, and zone colors to suit their preferences. Designed to be lightweight, it minimizes CPU usage while offering clear intraday reference points commonly used in technical analysis and scalping strategies.
지표 프로필
고객 리뷰
4.0
리뷰: 1
5 | 0 % | |
4 | 100 % | |
3 | 0 % | |
2 | 0 % | |
1 | 0 % |
고객 리뷰
October 20, 2025
Clean and visual 🎨 - Daily Open Zones make trend bias crystal clear. Great tool for intraday planning and momentum entries!
상담
자주 묻는 질문(FAQ)
Forex
Scalping
EURUSD
Crypto
Grid
XAUUSD
트레이딩 봇, 지표, 플러그인 등 cTrader Store에서 제공되는 상품은 제3자 개발자에 의해 제공되며, 이는 단순히 정보 및 기술적 접근을 목적으로 제공된 것입니다. cTrader Store는 중개인이 아니며, 투자 조언, 개인별 추천 또는 향후 성과에 대한 어떠한 보장도 제공하지 않습니다.
이 작성자의 상품 더 보기


가격
가입일 13/09/2025
27
판매
5.4K
무료 설치