
Descripción
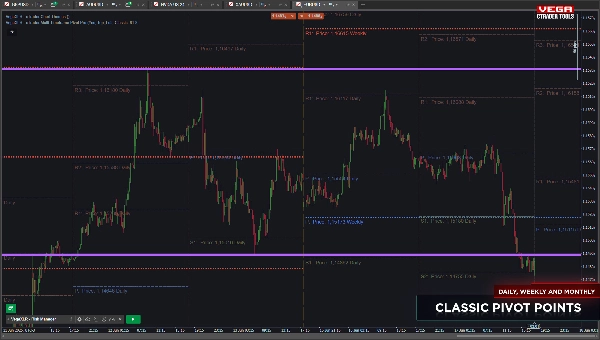
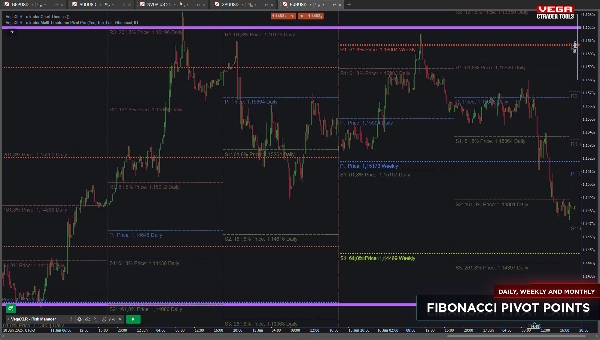
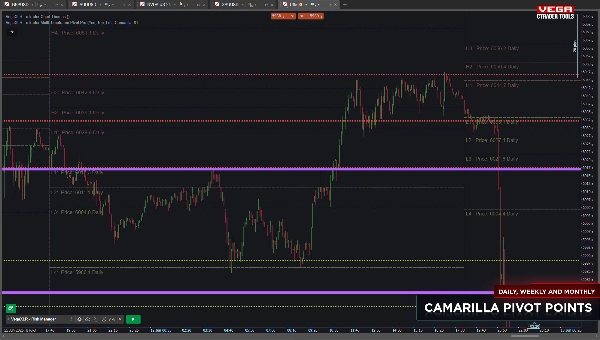
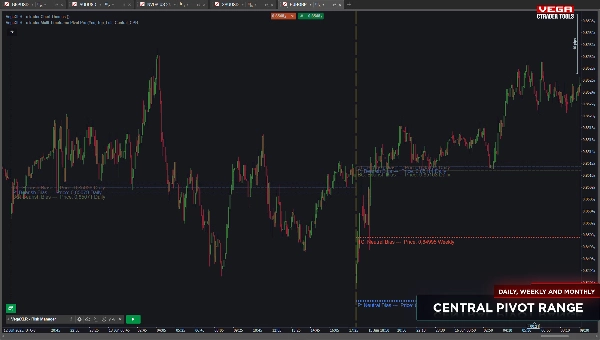
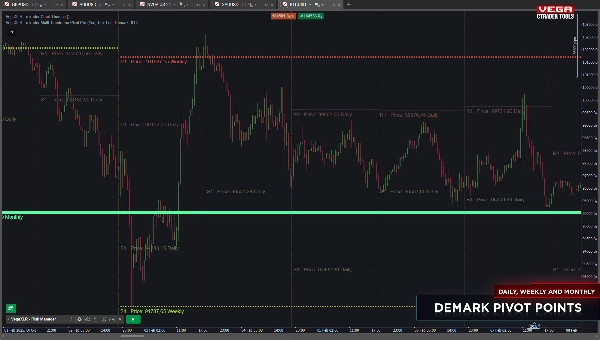
El cTrader Multi-Timeframe Pivot Pro es un indicador de puntos pivote altamente personalizable y con muchas funciones para cTrader. Permite mostrar puntos pivote para hasta tres marcos temporales de su elección, seleccionando entre cualquier marco temporal disponible en la plataforma. El indicador soporta múltiples estilos de pivote, incluyendo Clásico, Fibonacci, Demark, Camarilla y Rango Central de Pivote (CPR), lo que lo hace adecuado para diversas estrategias de trading.
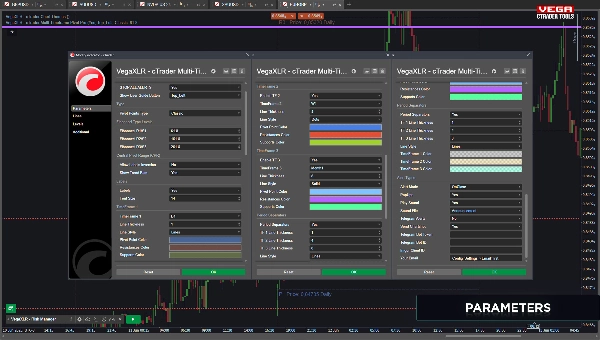
Puede personalizar completamente las etiquetas, tamaños de fuente, colores y niveles de pivote para todos los marcos temporales. Para los pivotes Fibonacci, puede elegir hasta tres niveles (por defecto: 61.8, 161.8, 261.8) junto con el nivel fijo de pivote central 0%. El modo CPR ofrece opciones como etiquetas de sesgo de tendencia y configuraciones de inversión para mayor funcionalidad.
Las características adicionales incluyen separadores de período para marcar claramente los períodos de trading y alertas en tiempo real cuando el precio interactúa con los niveles de pivote. Las alertas pueden enviarse mediante ventanas emergentes de cTrader, Telegram (con capturas opcionales del gráfico) o correo electrónico, asegurando que nunca pierda movimientos importantes del precio.
Este indicador es ideal para traders que buscan precisión, flexibilidad y herramientas avanzadas para mejorar su análisis técnico.
Aquí hay una lista completa de características para el cTrader Multi-Timeframe Pivot Pro indicador:
- Soporte Multi-Marco Temporal:
-
- Mostrar puntos pivote para hasta tres marcos temporales personalizables.
- Elegir entre cualquier marco temporal disponible en la plataforma cTrader.
- Múltiples Estilos de Pivote:
-
- Clásico
- Fibonacci (con hasta tres niveles: por defecto 61.8, 161.8, 261.8)
- Demark
- Camarilla
- Rango Central de Pivote (CPR) con etiquetas de sesgo de tendencia y configuraciones de inversión.
- Apariencia Personalizable:
-
- Colores de etiquetas y tamaños de fuente totalmente ajustables.
- Niveles y estilos de pivote personalizables para cada marco temporal.
- Alertas en Tiempo Real:
-
- Alertas activadas cuando el precio interactúa con cualquier nivel de pivote.
- Notificaciones mediante ventanas emergentes de cTrader.
- Alertas de Telegram con capturas de pantalla del gráfico.
- Notificaciones por correo electrónico.
- Separadores de Período:
-
- Marcar claramente el inicio y fin de los períodos de trading en el gráfico.
- Análisis de Trading Mejorado:
-
- Proporciona niveles clave de precio para mejores decisiones de trading.
- Soporta diversas estrategias de trading con estilos de pivote flexibles.
Estas características hacen del cTrader Multi-Timeframe Pivot Pro una herramienta versátil y poderosa para traders que buscan mejorar su análisis técnico y precisión en el trading.
Resumen
Users can fully customize label colors, font sizes, and pivot levels for each timeframe. The indicator includes period separators to visually mark trading sessions on the chart. Real-time alerts notify users when price interacts with pivot levels, with notifications available via cTrader pop-ups, Telegram (including optional chart screenshots), and email.
This tool provides key price levels to support various trading strategies, enhancing technical analysis precision and flexibility for traders using the cTrader platform.
Valoraciones de clientes
5 | 100 % | |
4 | 0 % | |
3 | 0 % | |
2 | 0 % | |
1 | 0 % |


