
Descripción
El indicador BLOCK LIQUIDITY combina dos enfoques principales para el análisis del mercado:
Detección de Bloques de Orden:
Identifica áreas de soporte y resistencia basadas en máximos y mínimos no superados dentro de un período de retroceso.
Genera señales de compra cuando el precio cierra por encima de un mínimo no superado.
Genera señales de venta cuando el precio cierra por debajo de un máximo no superado.
Análisis de Liquidez:
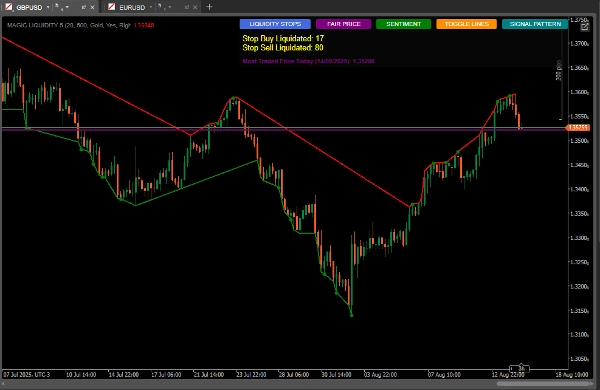
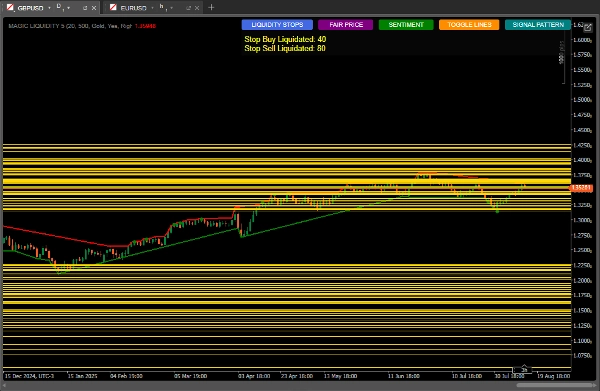
Detecta piscinas de liquidez (áreas donde pueden concentrarse órdenes de stop loss).
Monitorea la activación de stops de compra y venta.
Calcula el sentimiento del mercado basado en la distribución de liquidez.
Identifica el precio más negociado (precio justo).
Cómo usar para mejores resultados
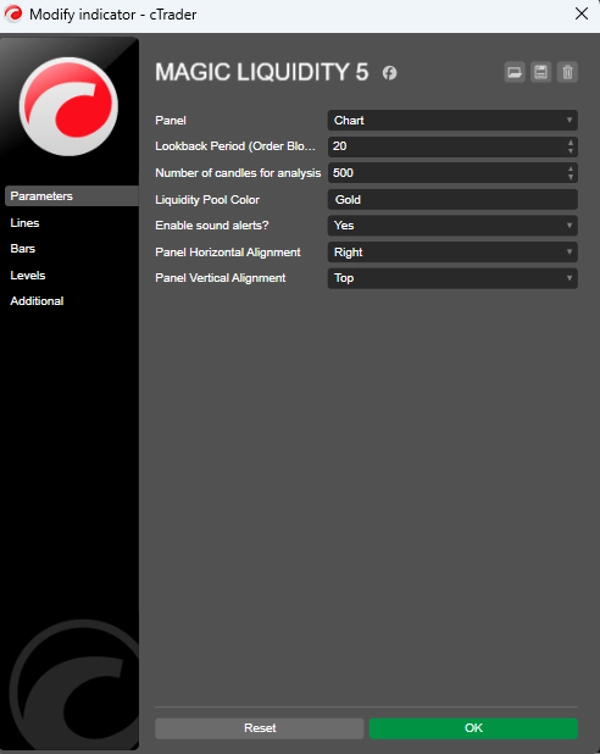
Configuración inicial
Período de retroceso: Ajusta el parámetro "Lookback Period" según el marco temporal en el que operes (valores más altos para marcos temporales mayores).
Número de velas para análisis: Manténlo en 500 para un análisis robusto o redúcelo para reacciones más rápidas.
Color de la piscina de liquidez: Elige un color que destaque en tu gráfico.
Interpretación de señales
Señales de Bloques de Orden:
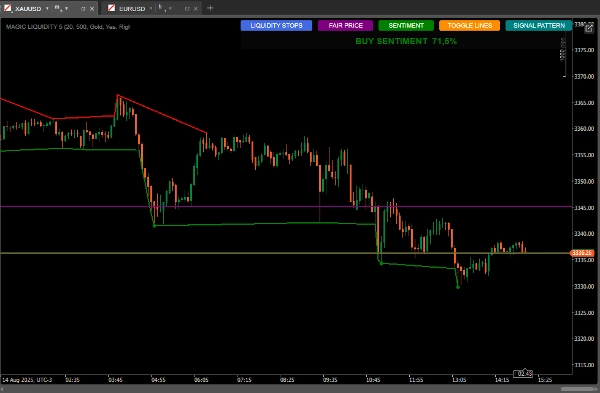
Puntos verdes: señales de compra cuando el precio cierra por encima de un mínimo no superado.
Puntos rojos: señales de venta cuando el precio cierra por debajo de un máximo no superado.
Piscinas de liquidez:
Las líneas horizontales muestran áreas de liquidez (objetivos potenciales o puntos de reversión).
Monitorea la relación entre la liquidez por encima/debajo del precio actual.
Sentimiento del mercado:
Usa el botón "SENTIMENT" para ver la dirección predominante y la confianza.
Un sentimiento de compra con alta confianza sugiere crecimiento continuo. Un sentimiento de venta con alta confianza sugiere continuación bajista.
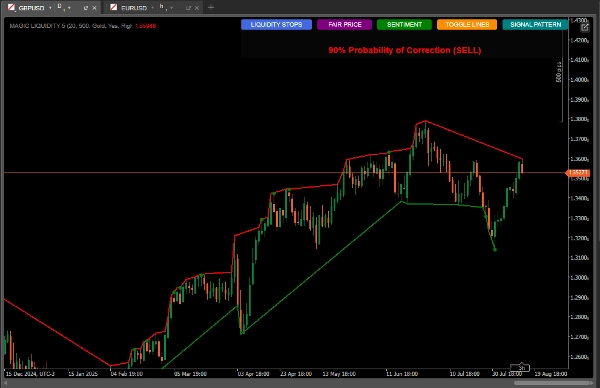
Patrones de velas:
El botón "SIGNAL PATTERN" analiza y
Muestra probabilidades de corrección basadas en la proporción cuantitativa
Precio más negociado (Precio justo):
El botón "FAIR PRICE" muestra el nivel de precio con el mayor volumen del día.
Puede actuar como un imán para los precios o como soporte/resistencia.
Estrategias de uso
Estrategia conservadora:
Opera solo cuando las señales de bloques de orden coincidan con el sentimiento predominante.
Usa las piscinas de liquidez como objetivos de toma de ganancias.
Estrategia agresiva:
Anticipa reversiones cuando el precio se acerca a piscinas de liquidez con muchas órdenes de stop acumuladas.
Usa divergencias entre el sentimiento y la acción del precio para operaciones contracorriente.
Confirmación adicional:
Compara con el patrón de velas mostrado por el indicador.
Verifica si el precio justo está cerca como área de interés.
Gestión de riesgos.
Stop-Loss:
Colócalo debajo del bloque de orden más reciente para compras
Colócalo encima del bloque de orden más reciente para ventas
Take-Profit:
Objetivos en piscinas de liquidez cercanas
Considera la proporción de liquidez arriba/abajo para establecer objetivos
Consejos avanzados
Usa el botón "TOGGLE LINES" para desactivar las líneas de liquidez cuando el gráfico se vuelva saturado
Monitorea el conteo de stops liquidados para evaluar la fuerza del movimiento
El precio justo es especialmente útil en mercados laterales como soporte/resistencia dinámicos
Combina con otros indicadores para confirmación (volumen, medias móviles)
Volumen del indicador:
https://ctrader.com/pt/products/635
Resumen
Users can customize parameters such as lookback period and number of candles analyzed to suit different timeframes and trading styles. Visual signals include green and red dots for buy and sell order block signals, and horizontal lines marking liquidity pools. Additional features include sentiment indication with confidence levels, candlestick pattern analysis for correction probabilities, and toggling of liquidity lines for chart clarity.
Recommended strategies include trading in the direction of order block signals aligned with sentiment for conservative approaches, or anticipating reversals near liquidity pools for aggressive trades. Risk management is supported by placing stop-loss orders relative to recent order blocks and setting take-profit targets at liquidity pools. The indicator can be combined with other tools like volume and moving averages for confirmation.
Valoraciones de clientes
5 | 100 % | |
4 | 0 % | |
3 | 0 % | |
2 | 0 % | |
1 | 0 % |


![Logotipo de "[Hamster-Coder] Moving Average MTF"](https://cdn.ctrader.com/image/webp/b11b98b1-194d-4b8e-b00e-d611826ad159_31226)


