

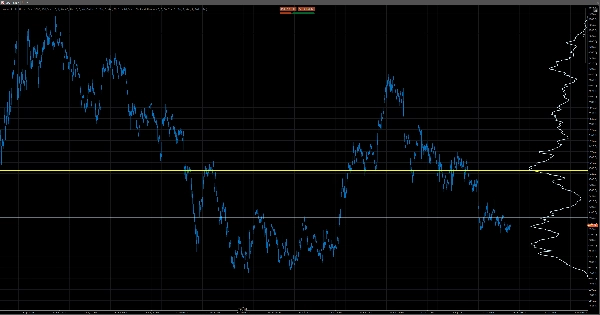
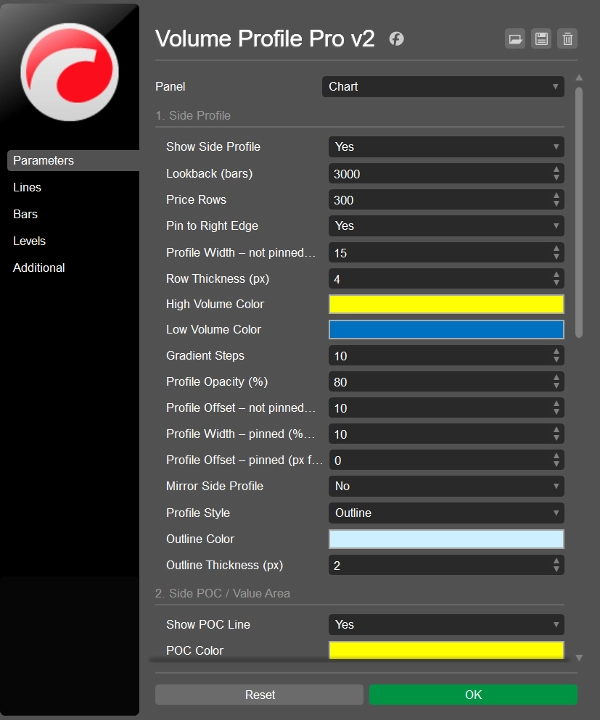
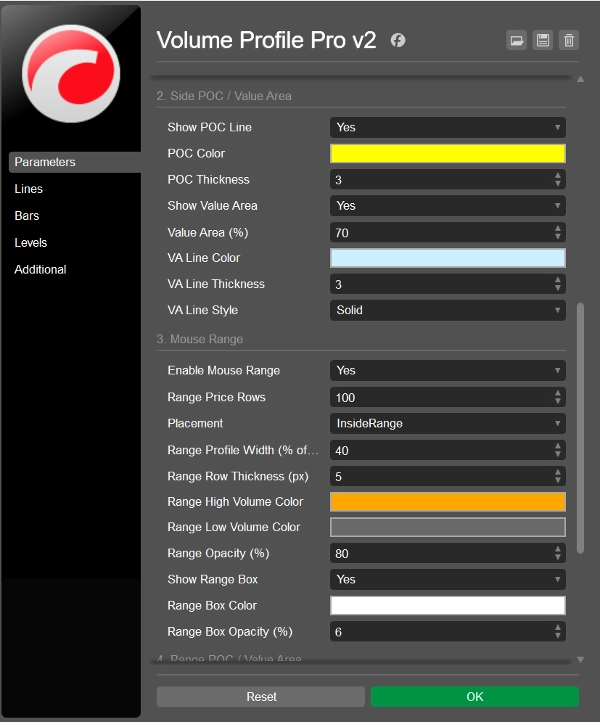
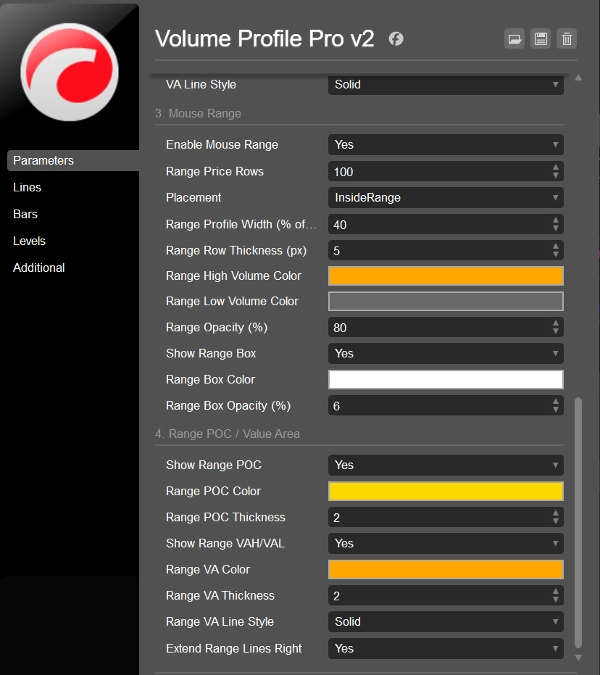
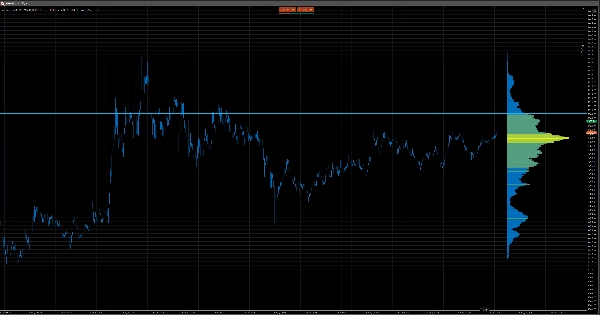
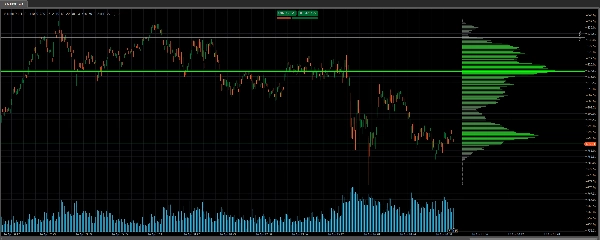
Opis
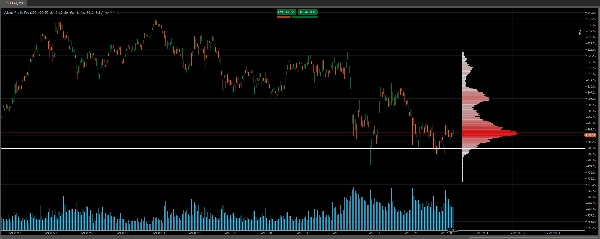
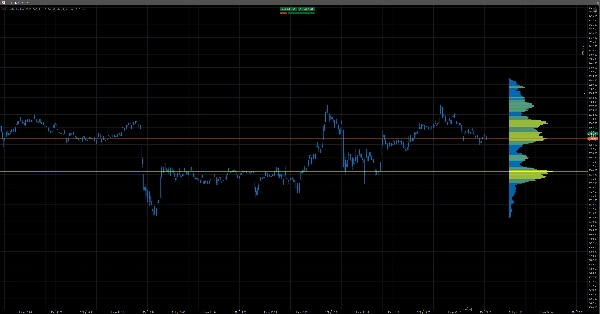
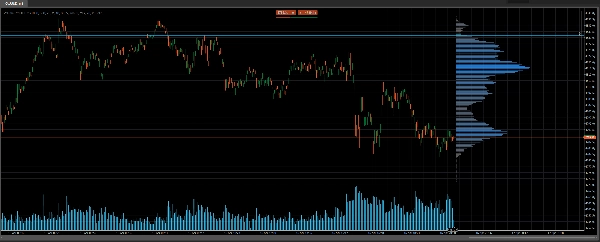
NOWY Volume Profile Pro v2 to wysoce konfigurowalny i lekki wskaźnik profilu wolumenu bocznego i zakresowego dla cTrader, w którym możesz dostosować wiele ustawień do swoich preferencji, w tym Point Of Control (POC), Value Area High (VAH) oraz Value Area Low (VAL)
Co robi
Volume Profile Pro rysuje poziomy dynamiczny histogram bezpośrednio po prawej stronie wykresu cTrader, pokazując, ile wolumenu zostało zrealizowane na każdym poziomie cenowym w konfigurowalnym oknie czasowym. Zamiast mierzyć wolumen w czasie, mierzy wolumen według ceny — natychmiast ujawniając, gdzie na rynku dokonano najwięcej transakcji. Na tej podstawie automatycznie oblicza i rysuje trzy kluczowe poziomy: Point of Control (POC), cenę z najwyższym wolumenem transakcji; oraz Value Area High (VAH) i Value Area Low (VAL), granice zakresu cenowego zawierającego 70% całkowitego wolumenu transakcji (konfigurowalne).
Jak to działa
Wskaźnik skanuje zdefiniowaną przez użytkownika liczbę historycznych świec, znajduje zakres cenowy od najwyższej do najniższej ceny i dzieli go na równomiernie rozmieszczone rzędy cenowe. Wolumen ticków każdej świecy jest następnie rozdzielany na każdy rząd cenowy, który obejmuje. Wynikiem jest histogram wolumenu według ceny z konfigurowalną szerokością słupków proporcjonalną do wolumenu oraz gradientowym schematem kolorów przechodzącym od rzędów o niskim do wysokiego wolumenu. Działa całkowicie na standardowych danych OHLCV na poziomie świec — bez potrzeby źródła ticków, DOM czy zewnętrznych danych — i przelicza się tylko na ostatniej świecy, co zapewnia szybkość, lekkość i brak zakłóceń.
Wysoka konfigurowalność
W Volume Profile Pro v2 niemal każdy element wizualny i analityczny jest regulowany:
- Okres cofania profilu bocznego
- Liczba rzędów cenowych i grubość rzędów
- Szerokość profilu
- Przezroczystość
- Gradientowy schemat kolorów
- Możliwość odwrócenia profilu bocznego
- Możliwość przypięcia profilu bocznego do prawej strony wykresu
- Opcja wyświetlania profilu bocznego jako pojedynczej linii zamiast słupków
- Kolor i grubość POC
- Próg procentowy Value Area
- Styl linii Value Area.
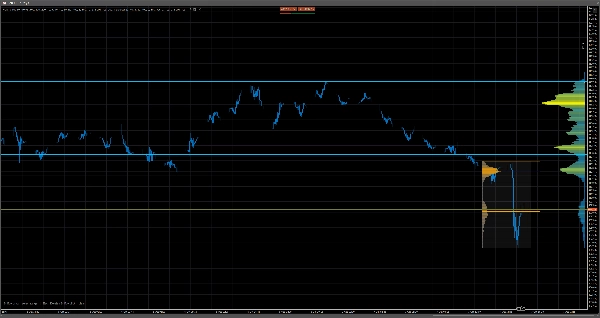
- Dodatkowo możesz teraz wyświetlić profil zakresu w wybranym zakresie. Wystarczy wybrać celownik, przeciągnąć go + przytrzymać shift, aby wybrać zakres i dwukrotnie nacisnąć przycisk Esc, aby usunąć profil zakresu.
Dzięki temu jest równie użyteczny jako subtelna warstwa odniesienia w tle, jak i wyraziste, samodzielne narzędzie analityczne.
Dla kogo to jest
- Traderzy, którzy chcą połączenia wskaźnika profilu wolumenu bocznego i zakresowego, który jest lekki
- Traderzy, którzy chcą czysty wizualnie profil wolumenu, gdzie można nawet wyświetlić profil wolumenu jako linię ciągłą
- Traderzy, którzy chcą samodzielnie ustawiać okres cofania na wykresie
- Traderzy, którzy chcą mieć możliwość ustawiania wielu kolorów i przezroczystości
- Traderzy, którzy chcą dostosować szerokość i położenie na wykresie lub mieć go przypiętego do boku
- Traderzy, którzy chcą ustawić liczbę rzędów cenowych (zaleca się utrzymanie poniżej 400)
- Traderzy, którzy chcą włączać lub wyłączać linie Point Of Control (POC), Value Area High (VAH) i Value Area Low (VAL) oraz dostosowywać ich wygląd
Połącz to z naszym wskaźnikiem Level 2 DOM Volume Delta Pro, aby podejmować jeszcze lepiej poinformowane decyzje na kluczowych poziomach: https://ctrader.com/products/4138
Zobacz nasz niesamowity Black Box Bot tutaj: https://ctrader.com/products/3241
Podsumowanie
The tool analyzes historical bar data by dividing the high-to-low price range into evenly spaced rows and distributing each bar’s tick volume across these rows. This creates a volume-at-price histogram with adjustable bar widths proportional to volume and a gradient color scheme indicating volume intensity. It operates solely on standard OHLCV bar data without requiring tick feeds or external sources, recalculating only on the latest bar to maintain performance.
Users can extensively customize visual and analytical settings, including lookback period, number of price rows, profile width, opacity, colors, and the appearance and visibility of POC, VAH, and VAL lines. This flexibility allows the indicator to serve as either a subtle background reference or a prominent analytical tool. It supports analysis of key market structure concepts such as supply and demand, support and resistance, and liquidity zones.
Opinie klientów
5 | 33 % | |
4 | 67 % | |
3 | 0 % | |
2 | 0 % | |
1 | 0 % |







![Logo „[Hamster-Coder] Pivot Points MTF”](https://cdn.ctrader.com/image/webp/4c143e5a-309c-40e3-a578-f04d1e133ffa_31159)











