present
Зарегистрируйтесь и получите скидку $50 на первую покупку
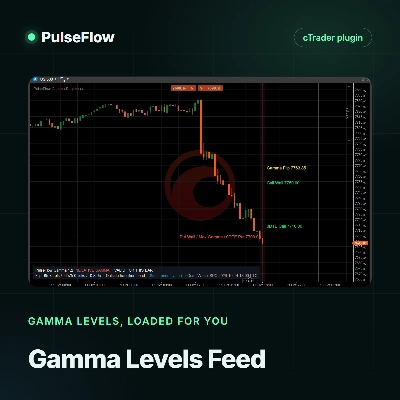
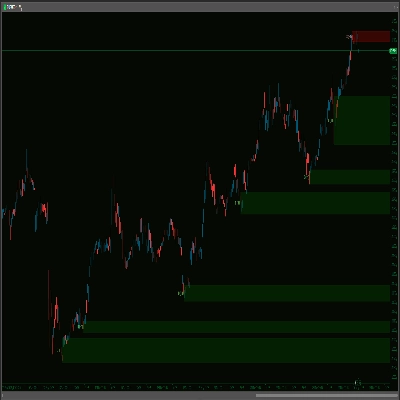
Trading product for PulseFlow Imbalance Sessions and ADR Индикатор Fair Value Gap Key Levels, image 1
PulseFlow Imbalance Sessions and ADR
Индикатор
Версия 1.0, Oct 2026
Windows, Mac
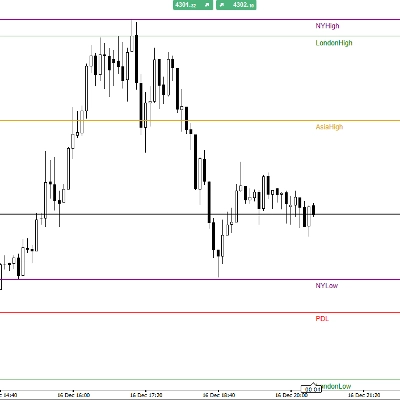
Trading product for PulseFlow Imbalance Sessions and ADR Индикатор Fair Value Gap Key Levels, image 2
Trading product for PulseFlow Imbalance Sessions and ADR Индикатор Fair Value Gap Key Levels, image 3
Trading product for PulseFlow Imbalance Sessions and ADR Индикатор Fair Value Gap Key Levels, image 4
С 14/10/2026

Описание

Launch price: $19 until November 14, 2026. After that date, the price returns to $33.

A clean chart, with nothing important hiding on the left


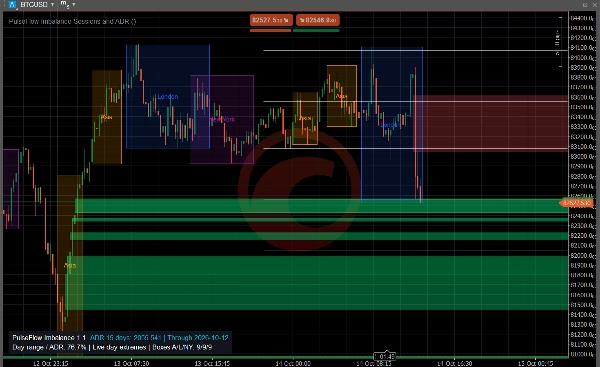
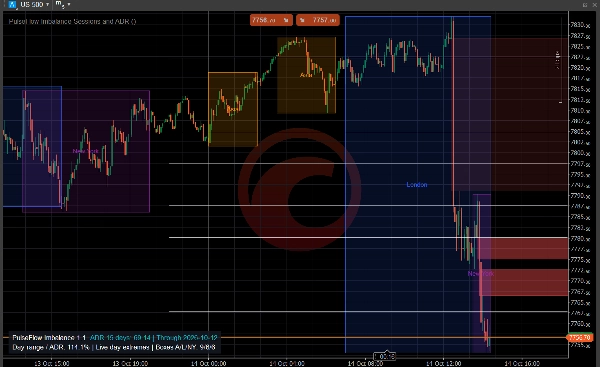
PulseFlow Imbalance Sessions and ADR keeps the structure that matters in front of you: open imbalance zones (fair value gaps), untouched session highs and lows, and how far the day has travelled against its average range. You read the chart at a glance, without dragging it back in time. It helps you make better decisions with clear references.


The zone you needed, lost to the left

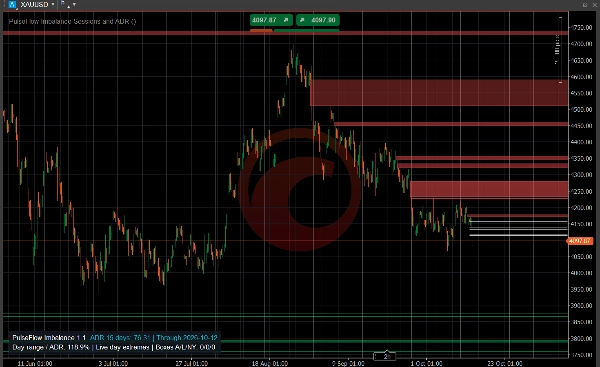
A fast move leaves an imbalance behind. By the time price comes back, it can be far off screen, and you wonder whether it was ever filled. Here, open zones stay in view until price fills them.


Only what is still open

- Bullish zones in green, bearish zones in red, extended to the right.

- Gaps that are small compared with the average daily range (ADR) are ignored, so only meaningful zones are drawn.

- A zone shrinks live as price trades back into it and disappears once it is completely filled.

- The shade of each zone shows the volume behind the move that created it: darker when volume was low, brighter when it was high. Volume comes from cTrader tick volume.


The map of the day

- Boxes mark the Asia (Tokyo), London and New York sessions, each in its own colour.

- Dotted lines stay at the high and low of each finished session until price touches them.

- ADR projections at 50%, 75% and 100% of the average daily range, measured from the day's low and high or from the day open, show how much room the day has used.

- A compact panel shows the current ADR and the share of it the day has already covered.


Then the reading is yours

Watch what price does when it returns to an open zone or a session level: pause, rejection or a full fill. Optional cTrader pop-up alerts tell you about new imbalances, large imbalances relative to the ADR, first touches, partial fills and complete fills, so you can step away from the screen.


Type, instruments and timeframes

Chart overlay indicator for market structure: imbalance zones, session levels and daily range projections. It works on any market with candles, such as stock indices, forex, gold and cryptocurrencies. Imbalance zones work on all standard time-based charts. Session boxes need an intraday chart and read best up to the 1-hour chart. ADR projections are available on intraday and daily charts. Tick, Renko, range and Heikin Ashi charts are not supported.


Keep in mind

Zones are drawn when the third candle closes, after the move, never ahead of it. Sessions are clock windows without a holiday calendar and can be switched off. The ADR is an average of completed days, not a limit price must respect. Zones and levels are references, not entries, stops or targets, and price may ignore any of them.


Trading involves risk. Past performance does not guarantee future results.

Сводка

Профиль индикатора
Категория индикатора
Структура рынка (SMC)
Тип вывода
Визуализация
Требования к данным
Только бары
Поддерживаемые сигналы
Касание уровня

Обсуждение

Отзывы покупателей

0.0
Отзывы: 0
Отзывы покупателей
У этого продукта еще нет отзывов. Уже попробовали его? Поделитесь впечатлениями!

Частые вопросы

Fair Value Gap
Key Levels
Imbalance
Продукты, доступные в cTrader Store, включая торговых ботов, индикаторы и плагины, предоставляются сторонними разработчиками и доступны исключительно в информационных и технических целях. cTrader Store не является брокером и не предоставляет инвестиционные консультации, персональные рекомендации или какие-либо гарантии будущей доходности.

Больше от этого автора

Индикатор
RSI
Fibonacci
+1
Spot RSI divergences on your chart and get an entry, stop and six targets when your filters line up.
Индикатор
Key Levels
Market Structure
+1
See the day's percentage targets from the open, so you know where the session stands at a glance.
Индикатор
Key Levels
Support & Resistance
Add your provider's gamma levels by hand or automatically with our feed plugin, and see the gamma regime at a glance.
Десктопный плагин
External Data
HTTP Requests
Load live gamma levels from your own QuantWheel API key into PulseFlow Gamma Regime, with no more typing by hand.

Вам также может понравиться

Индикатор
SMC
Prop
+9
PDL/PDH/PWL/PWH and Session higs/lows (customizable)
Индикатор
ATR
Forex
+11
Trend-following indicator with dynamic ATR-based trailing stop for precise entry/exit signals
Логотип продукта "ADT_bigCandles"
Высокий рейтинг
4.7
(4)
$20
/
$40
Индикатор
ATR
Prop
Outside Candle Detector: Highlights major candles/zones with ATR filter & pattern labels. By Avydel Talbo, prop trader.
Индикатор
RSI
MACD
This indicator is a combination of MACD and RSI into one. This is perfect fusion and powerful indicator ever.
Индикатор
BOS
CHOCH
+5
A professional-grade cTrader indicator for traders following the Inner Circle Trader (ICT) methodology. It replaces 6–8
Индикатор
Forex
Signal
+4
Gann Pivot Vision is an innovative analytical tool that combines classic pivot reversal levels and Gann geometry
Индикатор
Parabolic SAR Alert - Trend reversal alerts with smart signals & custom alerts.
Индикатор
The long awaited new and improved Supply Demand Premium V2 indicator. Unlock greater trading opportunities now!
Логотип продукта "AutoAVWAP"
Высокий рейтинг
4.5
(4)
$19
/
$25
Индикатор
Prop
VWAP
+11
The best automatic anchored VWAP indicator every trader can get help from.
Индикатор
SMC
Forex
+4
Identifies institutional zones with Volume Delta (K) across any asset or chart for high-precision entry detection.
Индикатор
Fisher Transform with smoothing. Spot reversals and cycles with precision. Great for any market, any timeframe.
Индикатор
Key Levels
Support & Resistance
Add your provider's gamma levels by hand or automatically with our feed plugin, and see the gamma regime at a glance.
Индикатор
VWAP
Support & Resistance
Trading.FC$_vwap Algo shows VWAP trends, dynamic support/resistance and deviation bands to spot potential trade entries.
Индикатор
ATR
BOS
+5
Opening ranges, dynamic trend channels, and multi-scale breakout/retest analysis for clear intraday chart decisions.
Индикатор
Drawdown Monitor
Protect your funded account. Real-time Daily Equity Drawdown monitor with Green / Orange / Red flashing alerts.
Индикатор
The Advanced Volume Profile Indicator calculates POC, Median, and Mode, revealing key price levels for smarter trading.
Индикатор
Forex
Version 3: Full control of session display including start and end times of all 3 sessions!
Индикатор
BOS
EMA
+5
VWAP Bands indicator with 3 standard deviation levels, buy/sell zones, and a draggable ON/OFF button to toggle the entir

Цена

С 14/10/2026