OR Session Zones
Индикатор
Версия 1.1, Dec 2025
Windows, Mac
4.5
Отзывы: 2
Описание
OR Session Zones — Индикатор открытия диапазона для нескольких сессий
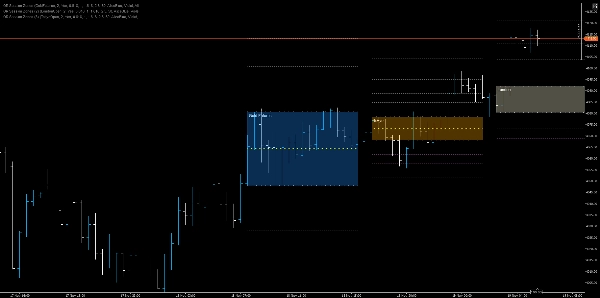
Высокоточный индикатор открытия диапазона, который определяет открытия сессий (NY, Лондон, EU, Токио, Шанхай, фьючерсы на золото/нефть), рисует динамические зоны OR high/low/mid, проецирует цели на основе Фибоначчи и отображает настраиваемую затенённую область для быстрого визуального принятия решений.
Ключевые особенности
- Обнаружение нескольких сессий: Родная поддержка открывающих баров Нью-Йорка, Лондона, EuroNext, Токио, Шанхая, фьючерсов на золото и нефть с использованием специализированных индикаторов сессий.
- Вычисление Opening Range: Рассчитывает OR High и OR Low по настраиваемому количеству свечей (RangeCandles) и фиксирует время начала сессии.
- Постоянные наложения на график: Рисует трендовые линии для OR High, OR Low и OR Mid (50%) по всему графику до настраиваемого времени продления.
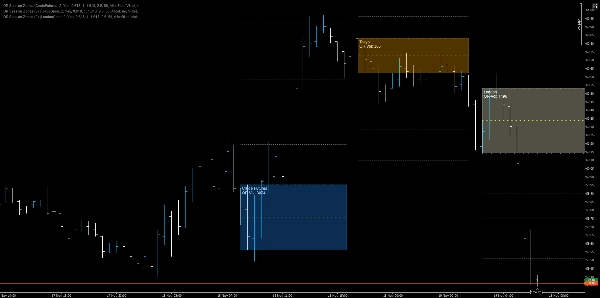
- Затенённая зона: Заполненный прямоугольник между OR High и OR Low с настраиваемой прозрачностью и цветом для каждой сессии для мгновенного визуального контекста.
- Проекции Фибоначчи: До четырёх линий проекции R (сопротивление) и S (поддержка), выведенных из диапазона OR с независимыми цветами и регулируемой прозрачностью.
- Гибкая видимость: Возможность скрывать или отображать индексированные (уникальные) ID объектов для предотвращения конфликтов; поддерживает как одиночные постоянные объекты, так и объекты на каждую свечу при включённом Hide.
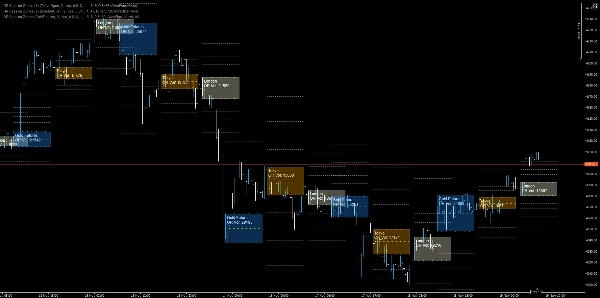
- Цветовое кодирование сессий: Каждая сессия использует отдельную цветовую схему (например, DodgerBlue, LightYellow, Orange, OrangeRed), чтобы сразу было понятно происхождение сессии.
Как это помогает трейдерам
- Быстрый контекст: Мгновенно видеть, где рынок открылся для основной сессии, и понимать раннюю структуру диапазона без ручных измерений.
- Триггеры для принятия решений: Используйте прорывы OR, отказы от средней линии и проекции Фибоначчи как правила входа/выхода или якоря для установки стопов.
- Мультисессионная стратегия: Комбинируйте перекрывающиеся OR (например, Лондон + NY) для обнаружения зон совпадения сессий и областей с более высокой вероятностью успешной сделки.
- Управление рисками: Размещайте стопы за стэками OR или используйте среднюю 50% как динамические цели для стопов/тейков.
Сценарии использования и пример правил
- Вход по прорыву: Покупка при закрытии выше OR High с подтверждением объёмом или импульсом; стоп чуть ниже OR High (или OR Mid для более жёстких выходов).
- Отскок от открытия: Шорт около OR High с подтверждением разворота, если цена не удерживается выше OR Mid и наблюдается быстрое оттягивание заявок на покупку.
- Сделка на совпадение сессий: Когда OR Лондона и NY перекрываются, рассматривайте перекрытие как зону с высоким доверием спроса/предложения и масштабируйте размер позиции соответственно.
- Цели проекции: Используйте R1/R2/R3/R4 как ступенчатые уровни тейк-профита и S1 - S4 симметрично для целей снижения.
Сводка
Профиль индикатора
Отзывы покупателей
4.5
Отзывы: 2
5 | 50 % | |
4 | 50 % | |
3 | 0 % | |
2 | 0 % | |
1 | 0 % |
Отзывы покупателей
November 22, 2025
Solid enough as a backup opinion, and It can look better than it is during a lucky run.
November 19, 2025
Обсуждение
Частые вопросы
Fibonacci
Forex
Breakout
Indices
EURUSD
Commodities
GBPUSD
XAUUSD
NAS100
Продукты, доступные в cTrader Store, включая торговых ботов, индикаторы и плагины, предоставляются сторонними разработчиками и доступны исключительно в информационных и технических целях. cTrader Store не является брокером и не предоставляет инвестиционные консультации, персональные рекомендации или какие-либо гарантии будущей доходности.


![Логотип продукта "Gaussian Channel [Iridio Capital]"](https://cdn.ctrader.com/image/webp/7c039209-5573-4a54-a072-f9528b503103_41960)

![Логотип продукта "[Hamster-Coder] Moving Average MTF"](https://cdn.ctrader.com/image/webp/b11b98b1-194d-4b8e-b00e-d611826ad159_31226)

Цена
26
Продажи
2.15K
Бесплатные установки