
Deskripsi
Indikator Multi-Timeframe Quantitative Qualitative Estimation (QQE)
Indikator Quantitative Qualitative Estimation (QQE) adalah alat analisis teknikal yang meningkatkan Relative Strength Index (RSI) dengan menggabungkan rata-rata bergerak yang dihaluskan. Ini membantu trader menilai kekuatan tren, potensi pembalikan, dan kondisi jenuh beli/jenuh jual dengan akurasi lebih tinggi.
QQE memiliki dua komponen utama: level trailing stop cepat dan lambat, yang berfungsi sebagai support dan resistance dinamis. Ini menjadikannya alat yang serbaguna untuk strategi mengikuti tren dan mean-reversion. Persilangan antara garis QQE dan garis sinyalnya sering menunjukkan potensi peluang beli atau jual.
Multi-Timeframe QQE: Versi Lanjutan
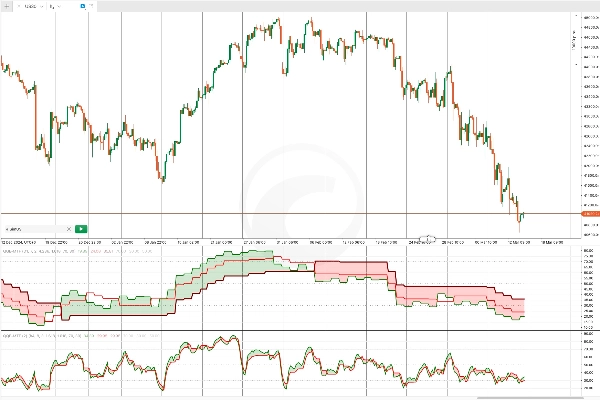
Versi peningkatan dari indikator QQE ini dirancang sebagai alat multi-timeframe, mengintegrasikan garis tren cepat dan lambat untuk presisi yang lebih baik. Dengan menganalisis aksi harga di berbagai timeframe, ini memberikan pandangan menyeluruh tentang tren pasar.
Algoritma penghalusan lanjutannya meningkatkan keandalannya, menjadikannya indikator mandiri yang efektif untuk:
✅ Mengidentifikasi arah tren
✅ Menghasilkan sinyal masuk dan keluar yang tepat
✅ Mendeteksi kondisi jenuh beli dan jenuh jual
Fleksibilitas Multi-Timeframe QQE membuatnya cocok untuk strategi mengikuti tren dan pembalikan.
Cara Menggunakan Multi-Timeframe QQE
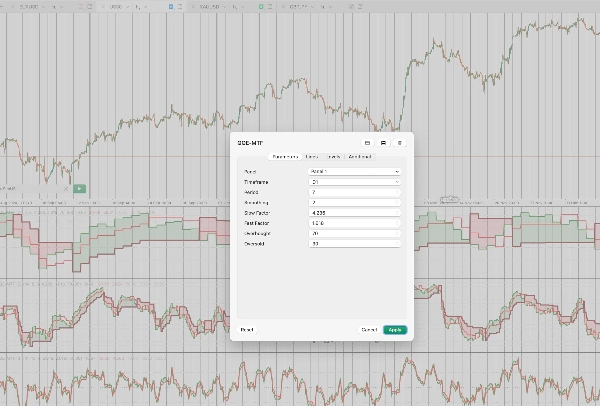
Untuk mengonfigurasi Multi-Timeframe QQE, trader harus memilih:
🔹 Sebuah timeframe (misalnya, Daily, H4, H1)
🔹 Periode (jumlah candle yang digunakan dalam perhitungan)
🔹 Periode penghalusan (untuk penghalusan RSI)
🔹 Faktor lambat dan cepat (untuk mengatur sensitivitas)
🔹 Level jenuh beli dan jenuh jual yang dapat disesuaikan
📌 Catatan: Karena ini adalah indikator multi-timeframe, setelah menambahkannya ke grafik, sangat penting untuk memperbesar tampilan keluar di antarmuka cTrader agar data yang cukup dapat dimuat dan indikator dapat diinisialisasi dengan benar.
Strategi Trading dengan Multi-Timeframe QQE
1️⃣ QQE untuk Konfirmasi Tren Timeframe Tinggi
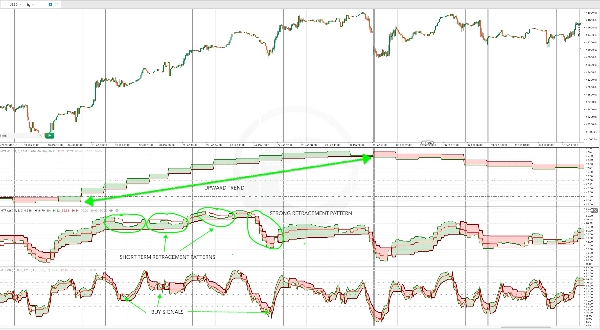
Salah satu cara efektif menggunakan Multi-Timeframe QQE adalah untuk konfirmasi tren pada timeframe yang lebih tinggi sambil mengidentifikasi entri retracement pada timeframe yang lebih rendah.
Misalnya:
- Indikator QQE pada timeframe harian digunakan untuk mengonfirmasi tren yang kuat.
- Entri retracement kemudian diidentifikasi saat Stochastic Oscillator melintasi level jenuh beli atau jenuh jual.
Metode ini membantu trader menyelaraskan entri mereka dengan tren keseluruhan.
2️⃣ Analisis Multi-Timeframe untuk Wawasan Pasar yang Lebih Dalam
Menggunakan QQE di berbagai timeframe memungkinkan trader memperoleh pemahaman yang lebih rinci tentang perilaku aset.
Misalnya, dengan menerapkan QQE pada:
📊 Timeframe harian (D1): Menentukan arah tren keseluruhan.
📊 Timeframe 4 jam (H4): Mengonfirmasi arah tren dan mengidentifikasi pullback jangka pendek.
📊 Timeframe 1 jam (H1): Menghasilkan sinyal masuk yang tepat berdasarkan kondisi jenuh beli/jenuh jual atau pergerakan berlawanan tren.
Pendekatan terstruktur ini meningkatkan penentuan waktu trading dan pengambilan keputusan dengan menyelaraskan sinyal di berbagai timeframe.
Ringkasan
This advanced multi-timeframe tool integrates fast and slow trend lines to analyze price action across different timeframes, providing a comprehensive view of market trends. Its smoothing algorithm improves reliability, making it effective for identifying trend direction, generating precise entry and exit signals, and detecting overbought/oversold levels.
Users configure the indicator by selecting a timeframe (e.g., Daily, H4, H1), periods for calculation, smoothing period for RSI, sensitivity factors, and customizable overbought/oversold thresholds. It is recommended to zoom out in the cTrader interface after adding the indicator to allow sufficient data loading.
Typical strategies include using the QQE on higher timeframes for trend confirmation and on lower timeframes for entry timing, as well as multi-timeframe analysis to enhance trade timing and decision-making by aligning signals across timeframes.
Ulasan pelanggan
5 | 50 % | |
4 | 50 % | |
3 | 0 % | |
2 | 0 % | |
1 | 0 % |


![Logo "[Hamster-Coder] Bollinger Bands"](https://cdn.ctrader.com/image/webp/21d8e5d6-fb11-4bac-b9ee-cd05c2b76804_30327)


