
FairValueGap
Wskaźnik
2.15K pobrania
Wersja 1.0, Apr 2025
Windows, Mac
4.5
Opinie: 2
Opis
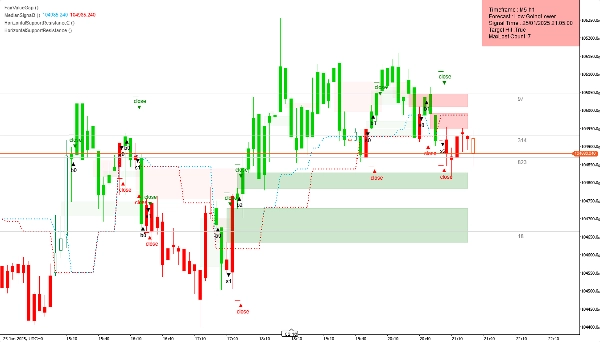
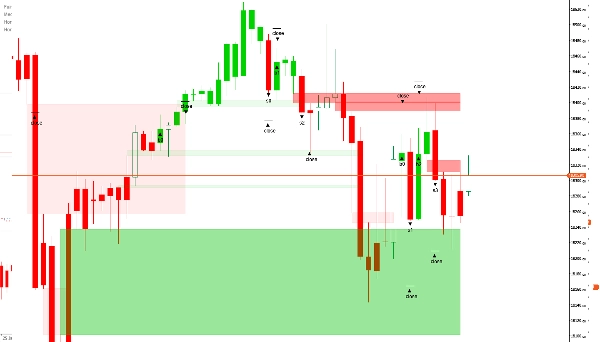
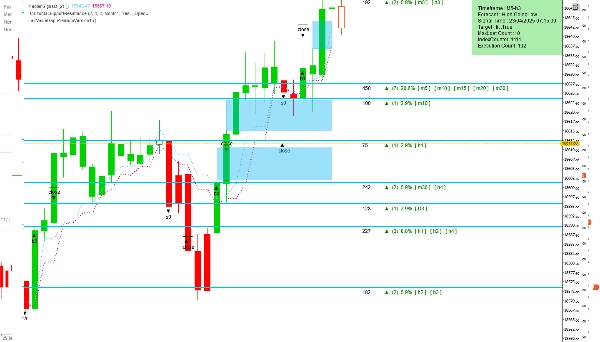
Wskaźnik Fair Value Gap (FVG) to narzędzie analizy technicznej zaprojektowane do identyfikacji potencjalnych nierówności cenowych na rynku. Luki te pojawiają się, gdy cena porusza się szybko, tworząc strefę z minimalną aktywnością handlową — często nazywaną „pustką”. Takie nierówności mogą wskazywać na prawdopodobieństwo korekty ceny, ponieważ rynek dąży do równowagi, wracając do tych obszarów.
Przegląd ustawień
- Ilość ładowanych świec: Określa liczbę historycznych świec do analizy, zaczynając od najnowszej zakończonej i cofając się wstecz.
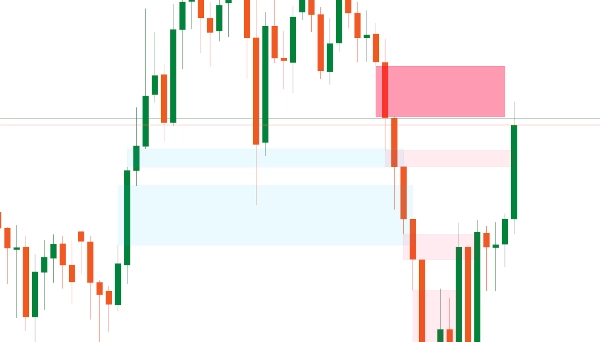
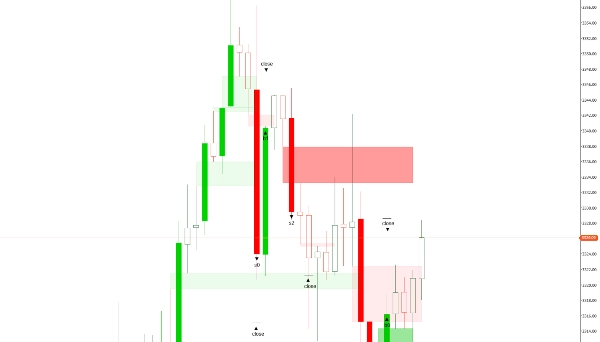
- Kolor byczego FVG: Ustawia kolor FVG pojawiających się w trendzie wzrostowym. Zastosowano 30% przezroczystości, aby elementy za luką pozostały widoczne.
- Kolor niedźwiedziego FVG: Ustawia kolor FVG pojawiających się w trendzie spadkowym, również z 30% przezroczystością dla lepszej widoczności na wykresie.
Funkcje premium (dostępne w wersji płatnej)
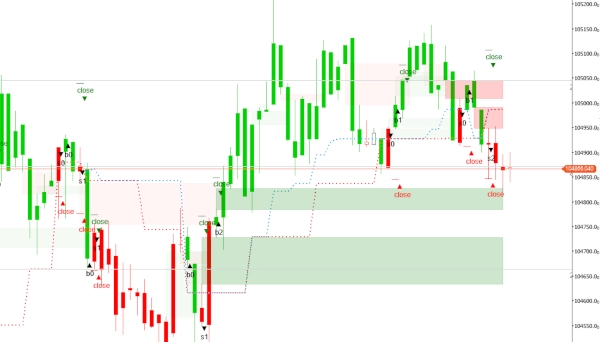
- Usuwanie zamkniętych luk: Ustawienie typu Boolean — po włączeniu („tak”) automatycznie usuwa wszystkie zamknięte luki; jeśli wyłączone („nie”), luki pozostają widoczne. Jest to szczególnie przydatne na niższych interwałach czasowych (poniżej 20 minut).
- Edycja/usuwanie luk: Pozwala traderom na ręczne dostosowywanie lub usuwanie luk. Daje to bardziej doświadczonym traderom większą kontrolę, zwłaszcza że bardzo małe luki zazwyczaj mają niewielki wpływ na ruch ceny.
- Ustaw interwał czasowy: Oferuje dwie opcje — użycie aktualnego interwału wykresu lub wybranie innego do analizy, przy jednoczesnym wyświetlaniu wyników na głównym wykresie. Ta funkcja pomaga traderom szybciej uzyskać wgląd w prawdopodobne ruchy rynku.
- Wybrany interwał czasowy: Określa żądany interwał do analizy, jeśli w powyższym ustawieniu wybrano „Wybrany interwał czasowy”.
- Dokładność małych luk: Pozwala traderom wprowadzić preferowany rozmiar luki jako liczbę całkowitą, co pomaga identyfikować luki, które historycznie prowadziły do korzystnych wyników. Wartość opiera się na całym zestawie danych i obserwowanych rozmiarach luk dla danego aktywa.
Domyślnie wskaźnik skanuje wszystkie nierówności w ramach jednego interwału czasowego. Jednak dostęp do funkcji premium poprzez wersję FairValueGapPremium może znacznie zwiększyć możliwości analityczne.
Podsumowanie
Podsumowanie AI
The Fair Value Gap (FVG) indicator is a technical analysis tool that identifies potential price imbalances in the market. These imbalances, or "gaps," occur when price moves rapidly, creating zones with minimal trading activity, often called "voids." Such areas may signal likely price retracements as the market tends to revisit these zones to restore balance.
Key settings include:
- Bars To Load: number of historical bars analyzed from the most recent backward.
- Bullish FVG Color: customizable color for gaps in uptrends with 30% transparency.
- Bearish FVG Color: customizable color for gaps in downtrends with 30% transparency.
Premium features (available in the paid version) enhance functionality by allowing:
- Automatic deletion of closed gaps, useful for lower timeframes.
- Manual editing or removal of gaps for finer control.
- Selection of analysis timeframe independent of the chart’s timeframe.
- Input of preferred gap size to improve identification accuracy based on historical data.
By default, the indicator scans imbalances within a single timeframe, with premium options providing expanded analytical capabilities.
Profil wskaźnika
Opinie klientów
4.5
Opinie: 2
5 | 50 % | |
4 | 50 % | |
3 | 0 % | |
2 | 0 % | |
1 | 0 % |
Opinie klientów
August 12, 2025
Pros: Automatically highlights the first session FVG and extends it to session end. Clean, minimal interface ideal for intraday analysis. Cons: No alerts or tooltips. Cannot save templates or track past session gaps.
August 6, 2025
Dyskusja
Częste pytania
Produkty dostępne za pośrednictwem cTrader Store, w tym boty handlowe, wskaźniki i wtyczki, dostarczane są przez deweloperów zewnętrznych i udostępniane wyłącznie w celach informacyjnych oraz w celu zapewnienia dostępu technicznego. cTrader Store nie jest brokerem i nie zapewnia doradztwa inwestycyjnego, nie udziela spersonalizowanych rekomendacji ani nie gwarantuje przyszłych wyników.
Więcej od tego autora


Cena
Od 19/04/2025
284.21M
Wolumen transakcji
1.08M
Zysk w pipsach
8
Sprzedaż
3.46K
Bezpłatne instalacje