

Opis
SUPER TREND OSCILLATOR TRIAL DAY15
"UWAGA," W WERSJACH PŁATNYCH DOSTĘPNA JEST RÓWNIEŻ BEZPŁATNA WERSJA PRÓBNA NA 15 DNI" kliknij na produkt płatny, a znajdziesz wersję darmową-
Uproszczony SuperTrend Oscillator - Pełny opis
Przegląd
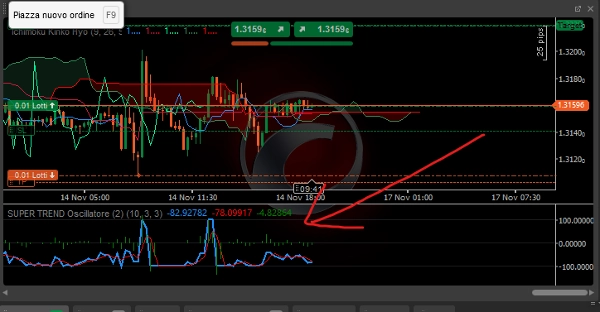
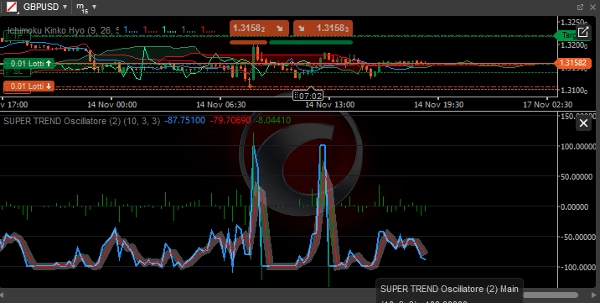
Uproszczony SuperTrend Oscillator jest zaawansowanym wskaźnikiem technicznym dla cTrader, który przekształca klasyczny SuperTrend w wizualny oscylator, ułatwiając identyfikację kierunku trendu, jego siły i wiarygodności.
Główne składniki
1. Linia główna (niebieska)
- Funkcja: Pokazuje znormalizowaną odległość między ceną a linią SuperTrend
- Obliczenia:
((Price - SuperTrend) / (ATR × Multiplier)) × 100 - Interpretacja:
-
- > 0: Trend wzrostowy (cena powyżej SuperTrend)
- < 0: Trend spadkowy (cena poniżej SuperTrend)
- Zakres: Od -100 do +100
2. Linia sygnału (czerwona)
- Funkcja: Prosta średnia krocząca linii głównej
- Okres: Konfigurowalny (domyślnie 3 okresy)
- Zastosowanie: Filtruje szumy rynkowe i potwierdza sygnały
3. Histogram (szary)
- Funkcja: Różnica między linią główną a linią sygnału
- Interpretacja:
-
- Pozytywny: Przyspieszający impet wzrostowy
- Negatywny: Przyspieszający impet spadkowy
- Przecięcie z zerem: Potencjalne odwrócenia impetu
Konfigurowalne parametry
Parametry SuperTrend:
- Okres ATR: Okres do obliczania Average True Range (domyślnie: 10)
- Mnożnik: Mnożnik dla pasm SuperTrend (domyślnie: 3.0)
Parametry oscylatora:
- Okres sygnału: Okres dla linii sygnału (domyślnie: 3)
Interpretacja sygnału
Warunki trendu:
- Silny trend wzrostowy:
-
- Linia główna > +50
- Linia główna > linia sygnału
- Pozytywny histogram
- Silny trend spadkowy:
-
- Linia główna < -50
- Linia główna < linia sygnału
- Negatywny histogram
- Rynek boczny:
-
- Linia główna między -30 a +30
- Częste przecięcia linii
Sygnały handlowe:
Wejście długie:
- Linia główna przecina 0 od dołu
- Histogram staje się pozytywny
- Linia sygnału potwierdza trend wzrostowy
- Linia główna powyżej +20 dla impetu
Wejście krótkie:
- Linia główna przecina 0 od góry
- Histogram staje się negatywny
- Linia sygnału potwierdza trend spadkowy
- Linia główna poniżej -20 dla impetu
Wyjście/Zysk:
- Długa pozycja: Linia główna > +80 (przekupienie) lub przecięcie poniżej linii sygnału
- Krótka pozycja: Linia główna < -80 (wyprzedanie) lub przecięcie powyżej linii sygnału
Zalety uproszczonej wersji
1. Optymalizacja wydajności
- Bardziej efektywne obliczenia
- Niższe zużycie zasobów
- Szybsza reakcja na zmiany cen
2. Łatwość użycia
- Zredukowana liczba niezbędnych parametrów
- Natychmiastowe sygnały wizualne
- Łatwa interpretacja nawet dla początkujących traderów
3. Niezawodność
- Mniej podatny na szumy
- Czystsze i bardziej wyraźne sygnały
- Zmniejszona liczba fałszywych sygnałów w porównaniu do klasycznego SuperTrend
Strategie użycia
Strategia podążania za trendem:
- Wejście: Linia główna > 0 dla pozycji długiej, Linia główna < 0 dla krótkiej
- Filtr: Histogram o tym samym znaku co linia główna
- Wyjście: Zmiana znaku lub osiągnięcie ekstremalnych poziomów
Strategia impetu:
- Wejście: Linia główna > +30 (długa) lub Linia główna < -30 (krótka)
- Potwierdzenie: Przyspieszający histogram
- Wyjście: Zwolnienie impetu (malejący histogram)
Strategia powrotu do średniej:
- Wejście: Linia główna > +80 (krótka) lub Linia główna < -80 (długa)
- Potwierdzenie: Odwrócenie histogramu
- Wyjście: Powrót w kierunku strefy neutralnej
Optymalne warunki rynkowe
Rynki trendujące:
- Wysoka efektywność
- Przedłużone sygnały
- Mniej fałszywych sygnałów
Rynki boczne:
- Zmniejsz wielkość pozycji
- Wydłuż ramy czasowe
- Używaj jako filtr impetu
Najlepsze praktyki
Zalecane ramy czasowe:
- Intraday: M15 - H1
- Swing Trading: H4 - D1
- Trading pozycyjny: W1 - MN
Zarządzanie ryzykiem:
- Stop Loss: 1,5-2 × ATR
- Take Profit: 2-3 × ryzyko
- Wielkość pozycji: 1-2% na transakcję
Dodatkowe potwierdzenia:
- Wyrównanie wielu ram czasowych
- Potwierdzenie wolumenu
- Kluczowe poziomy wsparcia/oporu
Ograniczenia
Uwagi:
- Wrodzone opóźnienie (wskaźnik podążający za trendem)
- Zmniejszona wydajność na rynkach bocznych
- Potrzeba potwierdzeń przy niskiej zmienności
Rekomendacje:
- Łącz z analizą price action
- Używaj jako filtr, nie jako samodzielny system
- Testuj na demo przed użyciem na żywo
Ten oscylator stanowi potężne narzędzie do identyfikacji silnych trendów i filtrowania fałszywych sygnałów, zachowując jednocześnie prostotę obsługi odpowiednią zarówno dla początkujących, jak i doświadczonych traderów.
Podsumowanie
Opinie klientów
5 | 0 % | |
4 | 100 % | |
3 | 0 % | |
2 | 0 % | |
1 | 0 % |


![Logo „[Stellar Strategies] Moving Averages Combined 1.0”](https://cdn.ctrader.com/image/webp/93692c9d-ac16-4dd8-ba83-5a62250c39a9_27250)