
Trend-reversal-indicator for cTrader
Wskaźnik
6 zakupy
Wersja 1.0, Mar 2025
Windows, Mac
4.0
Opinie: 1
Opis
Wskaźnik Odwrócenia Trendu dla cTrader
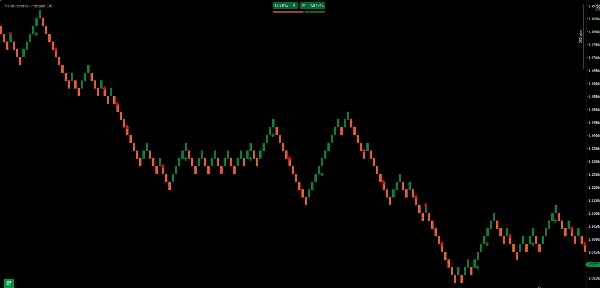
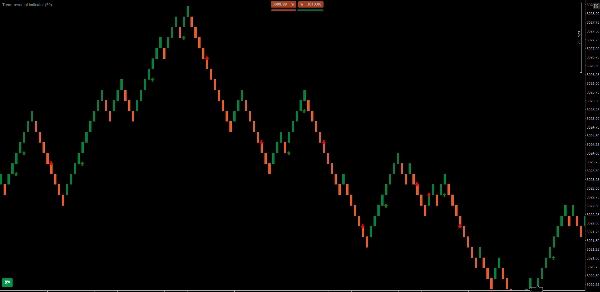
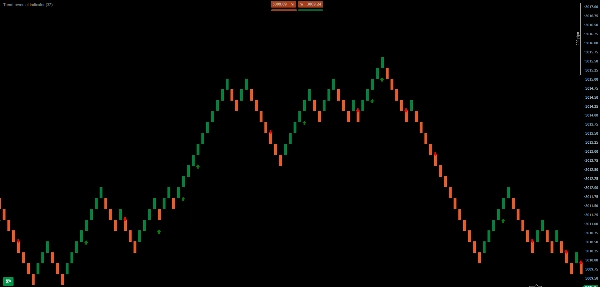
Optymalizowany pod wykresy Renko - Klucz do identyfikacji odwróceń trendu
Czy jesteś traderem korzystającym z wykresów Renko i szukasz sposobu na dokładniejsze wskazywanie odwróceń? Wskaźnik Odwrócenia Trendu to najlepsze narzędzie dla cTrader, zaprojektowane, aby dostarczać jasne i wiarygodne sygnały maksymalizujące Twoje zyski.
Kluczowe Funkcje
- Zaawansowana Analiza Odwrócenia Trendu
Napędzany inteligentnym algorytmem, Wskaźnik Odwrócenia Trendu analizuje struktury cenowe na wykresach Renko, dostarczając bardzo dokładne sygnały odwrócenia. - Intuicyjne Sygnały Wizualne
Zielone strzałki (kupno) i czerwone strzałki (sprzedaż) pojawiają się bezpośrednio na wykresie, ułatwiając dostrzeżenie okazji handlowych. - Wysoka Konfigurowalność
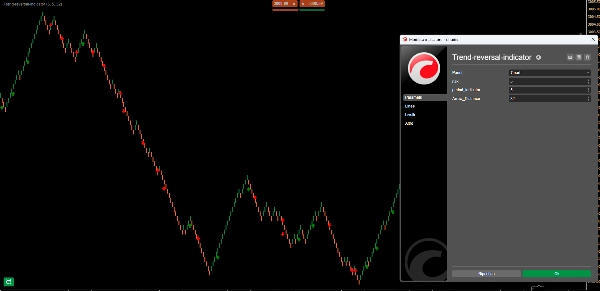
Dostosowywane ustawienia do Twojego stylu handlu: -
- Ryzyko: Określa czułość wskaźnika na odwrócenia trendu.
- Okres Wskaźnika: Ustawia liczbę słupków używanych w obliczeniach sygnału.
- Odległość Strzałek: Reguluje przestrzeń między strzałkami a ceną dla lepszej widoczności.
- W pełni kompatybilny z cTrader
Stworzony w cAlgo (C#), ten wskaźnik integruje się bezproblemowo z cTrader, zapewniając wysoką wydajność i płynne doświadczenie użytkownika.
Dlaczego wybrać Wskaźnik Odwrócenia Trendu?
- Filtruje Szumy Rynkowe: Eliminuje fałszywe sygnały, skupiając się na istotnych ruchach cen.
- Poprawia Timing: Pomaga wchodzenie i wychodzenie z transakcji w odpowiednim momencie.
- Pasuje do Każdej Strategii: Idealny zarówno do handlu intraday, jak i długoterminowych strategii opartych na Renko.
- Łatwy w Użyciu: Prosta konfiguracja, doskonały zarówno dla początkujących, jak i doświadczonych traderów.
Jak go zdobyć?
Kup Wskaźnik Odwrócenia Trendu już teraz i przenieś swój handel na cTrader na wyższy poziom!
✅ Kompatybilny ze wszystkimi ramami czasowymi Renko
✅ Dokładne i wiarygodne sygnały
✅ Dostosowywany do Twojego stylu handlu
Nie przegap tej okazji—Pobierz go już dziś!
Podsumowanie
Podsumowanie AI
The Trend-Reversal-Indicator for cTrader is designed specifically for traders using Renko charts to identify trend reversals with improved accuracy. It employs an intelligent algorithm to analyze price structures on Renko charts, delivering precise buy and sell signals represented by green and red arrows directly on the chart for easy recognition of trading opportunities.
Key features include:
- Advanced trend reversal analysis optimized for Renko charts.
- Intuitive visual signals with customizable arrow placement.
- Adjustable settings such as risk sensitivity, period indicator (number of bars used), and arrow distance for personalized trading styles.
- Full compatibility with cTrader, developed in cAlgo (C#) for seamless integration and high performance.
The indicator filters market noise by focusing on significant price movements, enhancing trade timing for entry and exit points. It suits various strategies, including intraday and long-term Renko-based approaches, and offers a straightforward setup suitable for both beginners and experienced traders.
Compatible with all Renko time frames, the Trend-Reversal-Indicator provides accurate, reliable signals and customization options to fit individual trading preferences within the cTrader platform.
Profil wskaźnika
Opinie klientów
4.0
Opinie: 1
5 | 0 % | |
4 | 100 % | |
3 | 0 % | |
2 | 0 % | |
1 | 0 % |
Opinie klientów
October 3, 2025
Nice little tool for spotting possible reversals. Super clear arrows on the chart. Works best on higher TFs. Don’t rely on it alone — combine with levels or volume for stronger entries.
Dyskusja
Częste pytania
Signal
Produkty dostępne za pośrednictwem cTrader Store, w tym boty handlowe, wskaźniki i wtyczki, dostarczane są przez deweloperów zewnętrznych i udostępniane wyłącznie w celach informacyjnych oraz w celu zapewnienia dostępu technicznego. cTrader Store nie jest brokerem i nie zapewnia doradztwa inwestycyjnego, nie udziela spersonalizowanych rekomendacji ani nie gwarantuje przyszłych wyników.


![Logo „[Hamster-Coder] Pivot Points MTF”](https://cdn.ctrader.com/image/webp/4c143e5a-309c-40e3-a578-f04d1e133ffa_31159)


Cena
7
Sprzedaż