
VegaXLR - Analysis Tools Alerts
Gösterge
2 satın almalar
Sürüm 1.1, Apr 2026
Windows, Mac
4.5
Değerlendirmeler: 2
Açıklama
cTrader Analysis Tools Alerts, çeşitli çizim araçlarına uyarılar, etiketler ve otomatik renk kodlaması ekleyerek grafik deneyiminizi geliştirmek için tasarlanmış hepsi bir arada bir göstergedir.
Özellikler:
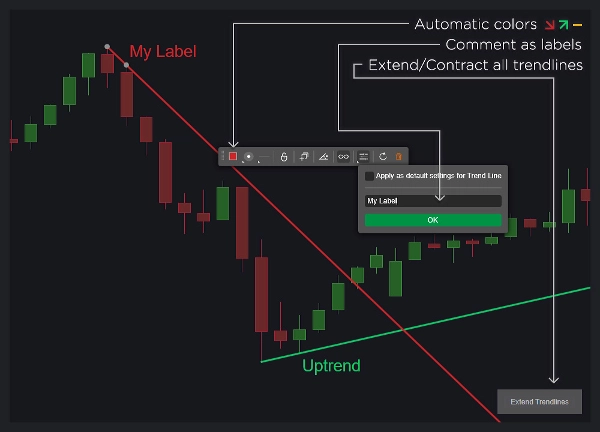
- Trend Çizgileri:
-
- Nesne yorumlarını kullanarak özel etiketler gösterin.
- Trend çizgisi yönüne bağlı dinamik renk değişiklikleri.
- Bir uyarıdan sonra trend çizgilerini kaldırma seçeneği.
- Trend çizgisine özgü uyarıları etkinleştirme veya devre dışı bırakma.
- Tüm trend çizgilerini tek tıklamayla uzatma veya kısaltma.
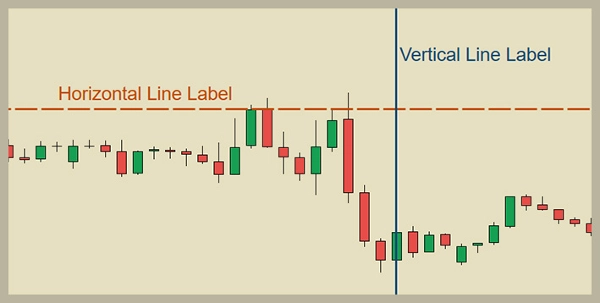
- Yatay ve Dikey Çizgiler:
-
- Nesne yorumlarını kullanarak özel etiketler gösterin.
- Bir uyarıdan sonra çizgileri otomatik olarak silin.
- Her çizgi türü için uyarıları yapılandırın.
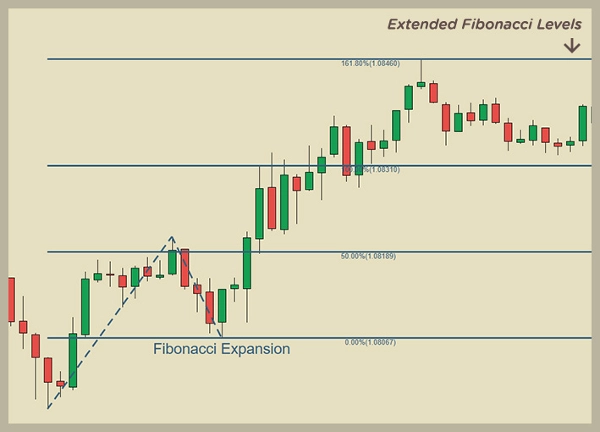
- Fibonacci Düzeltme ve Genişleme Seviyeleri:
-
- Nesne yorumlarını kullanarak özel etiketler gösterin.
- Seviye çizgilerini sonsuza kadar otomatik olarak uzatın.
- Bir uyarıdan sonra nesneleri silme seçeneği.
- Çizim yönüne göre renk atayın.
- Fibonacci seviyeleri için uyarıları etkinleştirme veya devre dışı bırakma.
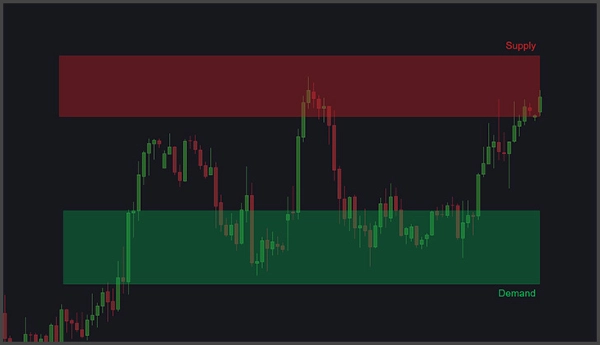
- Dikdörtgenler (Arz ve Talep Alanları):
-
- Nesne yorumlarını kullanarak özel etiketler gösterin.
- Fiyat etkileşimleri ve tick hacmi artışları için uyarılar.
- Tick hacmi artışı uyarıları için parametreleri ayarlayın; geriye dönük barlar, yüzde hacim artışı ve uyarı sonrası duraklama süresi dahil.
- Aktif mum üzerine otomatik dikdörtgen dolgu ve uzatma.
- Genel Özelleştirme:
-
- Her nesne türü için etiket pozisyonlarını ve metin boyutlarını ayarlayın.
- Otomatik renkleri özelleştirin.
- Uyarı mesajlarına nesne yorumlarını dahil edin.
- Her nesne türü için uyarıları etkinleştirin veya devre dışı bırakın.
- Uyarılar ve Yardım:
-
- Ses, açılır pencereler, Telegram ve e-posta yoluyla uyarılar alın.
- Telegram'a otomatik grafik ekran görüntüleri gönderilir.
- Grafikte küçük bir düğme aracılığıyla Kullanıcı Kılavuzuna erişim.
Bu araç, stratejilerinde destek ve direnç, arz ve talep, Fibonacci veya trend çizgilerini kullanan traderlar için idealdir.
Özet
YZ özeti
VegaXLR - Analysis Tools Alerts is an all-in-one indicator for the cTrader platform that enhances chart analysis by integrating alerts, labels, and automatic color-coding with various drawing tools. It supports trendlines, horizontal and vertical lines, Fibonacci retracement and expansion levels, and rectangles representing supply and demand areas.
Key features include:
- Trendlines: Custom labels from object comments, dynamic color changes based on direction, options to remove or extend trendlines after alerts, and toggle alerts per trendline.
- Horizontal and Vertical Lines: Custom labels, automatic deletion after alerts, and configurable alerts per line type.
- Fibonacci Levels: Custom labels, infinite extension of level lines, color assignment by drawing direction, and alert enable/disable options.
- Rectangles (Supply and Demand): Custom labels, alerts for price interactions and tick volume spikes with adjustable parameters, automatic fill and extension to the active candle.
- Overall customization allows adjustment of label positions, text sizes, automatic colors, inclusion of comments in alerts, and enabling/disabling alerts per object type.
- Alerts can be received via sound, pop-ups, Telegram, and email, with automatic chart screenshots sent to Telegram.
- A user guide is accessible directly on the chart.
This tool is suited for traders employing support and resistance, supply and demand, Fibonacci, or trendline strategies.
Gösterge profili
Gösterge kategorisi
Destek ve direnç
Çıktı türü
Görselleştirme
Veri gereklilikleri
Yalnızca çubuklar
Desteklenen sinyaller
Kesişim
Kırılma
Seviyeye dokunuş
Seviye kırılması
Yön değiştirme
Trend gücü
Müşteri değerlendirmeleri
4.5
Değerlendirmeler: 2
5 | 50 % | |
4 | 50 % | |
3 | 0 % | |
2 | 0 % | |
1 | 0 % |
Tartışma
SSS
Fibonacci
Forex
Supply & Demand
Support & Resistance
cTrader Store üzerinden erişilebilen işlem botları, göstergeler ve eklentiler gibi ürünler, üçüncü taraf sağlayıcılar tarafından sağlanır ve yalnızca bilgilendirme ve teknik erişim amaçlarıyla sunulur. cTrader Store bir broker değildir ve yatırım tavsiyesi, kişisel öneriler vermez veya gelecekteki performansı garanti etmez.


Fiyat
215
Satışlar
677
Ücretsiz yüklemeler