![Trading product for [Stellar Strategies] Visual Trend Momentum 指标 Signal Commodities, image 1](https://cdn.ctrader.com/image/webp/48aee0a5-f10e-4bc8-9671-78e156fcc5df_27548)
[Stellar Strategies] Visual Trend Momentum
指标
269 下载
版本 1.0, Mar 2025
Windows 版、Mac 版
5.0
评价:1
![Trading product for [Stellar Strategies] Visual Trend Momentum 指标 Signal Commodities, image 2](https://cdn.ctrader.com/image/webp/bf3e8d6e-4fe2-498f-9c94-fcc41b457306_27549)
![Trading product for [Stellar Strategies] Visual Trend Momentum 指标 Signal Commodities, image 3](https://cdn.ctrader.com/image/webp/606e7147-24a3-4137-b2c8-1245a4fbb93a_27550)
![Trading product for [Stellar Strategies] Visual Trend Momentum 指标 Signal Commodities, image 4](https://cdn.ctrader.com/image/webp/c6f6508a-0abf-4df2-a2ec-8954c481ec9e_27551)
![Trading product for [Stellar Strategies] Visual Trend Momentum 指标 Signal Commodities, image 5](https://cdn.ctrader.com/image/webp/f59e757b-aaa5-46aa-b41b-b5852db0a3ae_27552)
![Trading product for [Stellar Strategies] Visual Trend Momentum 指标 Signal Commodities, image 6](https://cdn.ctrader.com/image/webp/60e2a71a-ca6f-467f-a22f-fd4a31226ef6_27553)
说明
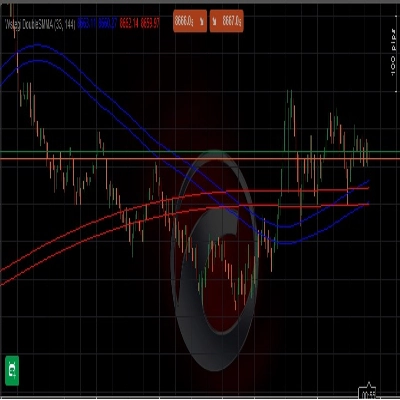
这个名为 VisualTrendMomentum 的 cAlgo 指标旨在通过结合移动平均线(MA)、平均真实波幅(ATR)和成交量分析,在图表上直观地表示趋势强度和动量。它旨在通过彩色钻石图标和箭头,为交易者提供潜在买卖信号以及趋势变化的清晰视觉指示。
主要特点:
- 趋势检测:
-
- 它使用三条指数移动平均线(快速、中等和慢速)来确定整体趋势方向。
- 根据这些移动平均线的排列以及当前K线的收盘价和开盘价,区分“强”和“弱”的买入/卖出信号。
- 波动性分析:
-
- 它结合了三条ATR指标(短期、中期和长期)来衡量市场波动性。
- 利用波动性水平来过滤和增强买卖信号。
- 成交量确认:
-
- 分析成交量以识别显著的成交量激增,这可以确认趋势强度。
- 使用乘数来设定显著成交量的水平。
- 趋势变化检测:
-
- 通过比较当前的强买/卖状态与之前的状态来检测趋势变化。
- 趋势变化通过向上或向下箭头突出显示。
- 视觉表现:
-
- 在图表上使用彩色钻石图标显示买卖信号,不同颜色表示信号强度(强与弱)。
- 趋势变化通过向上或向下箭头显示。
- 图标和箭头的颜色可以通过指标参数自定义。
- 可自定义参数:
-
- 该指标允许用户自定义移动平均线和ATR的周期、成交量乘数以及用于可视化的颜色。
如何使用该指标:
- 将指标添加到 cAlgo:
-
- 在 cAlgo 中打开一个图表。
- 从“指标”列表中将 [Stellar Strategies]
VisualTrendMomentum指标添加到图表。
- 配置参数:
-
- 根据您的交易风格和所分析的具体市场调整输入参数。
-
Fast MA Period,Medium MA Period,Slow MA Period:设置指数移动平均线的周期。Short ATR Period,Medium ATR Period,Long ATR Period:设置平均真实波幅指标的周期。Significant Volume Multiplier:调整乘数以定义显著的成交量水平。Strong Buy Color,Strong Sell Color,Weak Buy Color,Weak Sell Color,Trend Change Color:选择不同信号类型的颜色。
- 解读信号:
-
- 彩色钻石:
-
- 深绿色钻石:强买信号。
- 深红色钻石:强卖信号。
- 橄榄色钻石:弱买信号。
- 棕色钻石:弱卖信号。
- 箭头:
-
- 金色向上箭头:表示趋势由卖转买。
- 金色向下箭头:表示趋势由买转卖。
- 趋势强度:
-
- 钻石图标与成交量水平的结合提供了当前趋势强度的洞察。较高的成交量配合强买/卖钻石增强信号。
- 交易决策:
-
- 将指标信号与其他技术分析工具及您的交易策略结合使用。
- 在做出任何交易决策前,考虑整体市场环境和风险管理。
- 重要提示:
-
- 由于该指标使用移动平均线和ATR指标,因此它是一个滞后指标。
- 该指标在趋势市场中效果最佳。
- 请根据市场状况调整参数。
................................................................................................................................................................................................................
交易者警告:交易涉及重大风险,并非适合所有投资者。您可能会损失部分或全部投资资本。请务必充分了解风险,并在必要时寻求独立的财务建议。Visual Trend Momentum 指标是辅助识别趋势和潜在交易机会的工具,但不保证交易获利。
摘要
AI 摘要
[Stellar Strategies] Visual Trend Momentum is a cAlgo indicator that visually represents trend strength and momentum on trading charts by combining exponential moving averages (MAs), Average True Range (ATR), and volume analysis. It uses three MAs (fast, medium, slow) to determine trend direction and distinguishes between strong and weak buy/sell signals based on MA alignment and price action. Volatility is assessed through three ATR indicators (short, medium, long), which filter and reinforce signals. Tick volume analysis identifies significant volume spikes to confirm trend strength, adjustable via a volume multiplier.
Trend changes are detected by comparing current and previous strong buy/sell states and are marked with up or down arrows. Buy and sell signals appear as colored diamond icons on the chart, with colors indicating signal strength (strong vs. weak). All visual elements’ colors and indicator parameters—including MA and ATR periods and volume multiplier—are customizable.
Users add the indicator to cAlgo charts, configure parameters to suit their trading style and market, and interpret signals alongside other analysis tools. The indicator is lagging by nature and is most effective in trending markets. It provides visual cues to assist in identifying trends and potential trading opportunities but does not guarantee profitable trades.
指标配置
客户评价
5.0
评价:1
5 | 100 % | |
4 | 0 % | |
3 | 0 % | |
2 | 0 % | |
1 | 0 % |
客户评价
August 18, 2025
Clear trend momentum visualization, customizable, low resource usage. Cons: No MTF panel, no alerts, no auto-trading integration.
讨论
常见问答
Signal
Commodities
XAUUSD
ATR
cTrader Store 提供的所有产品,包括交易机器人、指标和插件,均由第三方开发者提供,仅供信息参考和技术访问之用。cTrader Store 并非经纪商,不提供投资建议、个人推荐或任何未来业绩保证。
该作者的其他作品
!["[Stellar Strategies] Market Structure Breakout" 标识](https://cdn.ctrader.com/image/webp/bceec265-3247-4b11-915f-6295a29c106d_28465)
!["[Stellar Strategies] Market Session Ultimate" 标识](https://cdn.ctrader.com/image/webp/61ffd537-0125-4246-9e72-42eca1791d64_28232)
!["[Stellar Strategies] BOS Trend 1.0" 标识](https://cdn.ctrader.com/image/webp/6cdec0f1-0e97-4a82-a8a4-2b67aed54d38_25695)
!["[Stellar Strategies] Inside Bar with Signals" 标识](https://cdn.ctrader.com/image/webp/1d9e8bfa-3b2c-4440-bb37-5856902008a7_30683)
!["[Stellar Strategies] Wave Trend Pro" 标识](https://cdn.ctrader.com/image/webp/5f226fbb-245a-41cd-9cdd-b018257d5e6d_28617)
!["[Stellar Strategies] Smart ADX" 标识](https://cdn.ctrader.com/image/webp/af13b084-b6f6-41db-b7bc-c7e688b57b05_36929)
!["[Stellar Strategies] Linear Regression Candles 1.1" 标识](https://cdn.ctrader.com/image/webp/8b9cff9f-2431-46d2-b0ec-c7f55f4a4a6d_27918)
!["[Stellar Strategies] VBO" 标识](https://cdn.ctrader.com/image/webp/f034c012-94d4-445a-a01b-febd1cdedaef_36944)
!["[StellarStrategies] Scheduled Trade Executor" 标识](https://cdn.ctrader.com/image/webp/daefc6af-7eca-453e-878d-1b981be2c401_25646)
!["[Stellar Strategies] Candlestick Patterns Dashboard" 标识](https://cdn.ctrader.com/image/webp/ae8691a5-4884-4553-9bcc-64e16ac82a30_38344)
!["[Stellar Strategies] SP500 Gap Closure cBot 1.0" 标识](https://cdn.ctrader.com/image/webp/92c23fdc-4ad1-4e61-bdb5-c77f6ec8c539_27686)
!["[Stellar Strategies] QQE" 标识](https://cdn.ctrader.com/image/webp/e702104a-874c-4b39-97dd-fb34518d1015_27712)
猜您喜欢


价格
20.46M
交易量
8K
盈利点数
25
销售
4.4K
免费安装