
说明
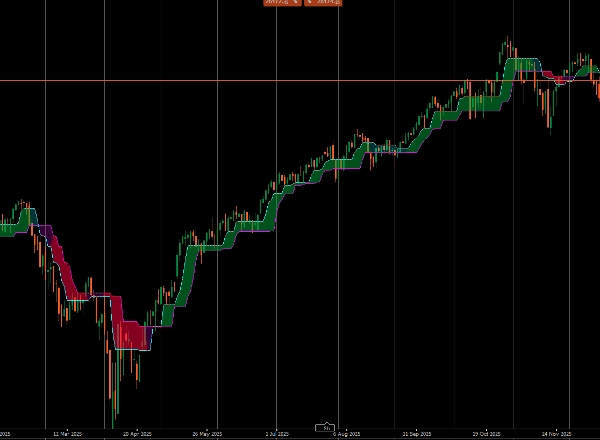
Half Trend Cloud 是一个干净的趋势叠加,围绕两个 Half Trend 层构建:一个快速线用于时机判断,另一个慢速线用于确认。它直接在价格上绘制两条线,并在它们之间填充一个云,以一目了然地突出显示趋势状况。
你所看到的
快速线(青色): 用于早期方向变化和入场时机的反应层。
慢速线(品红色): 用于过滤噪音和定义主要趋势偏向的确认层。
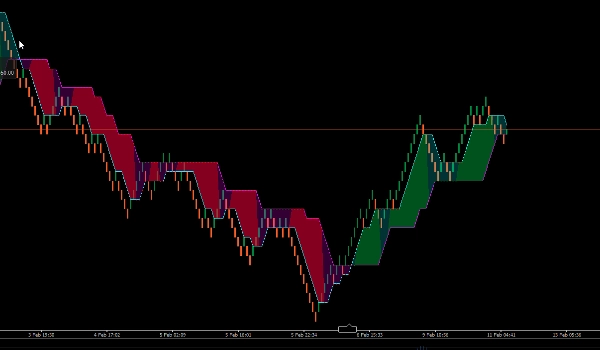
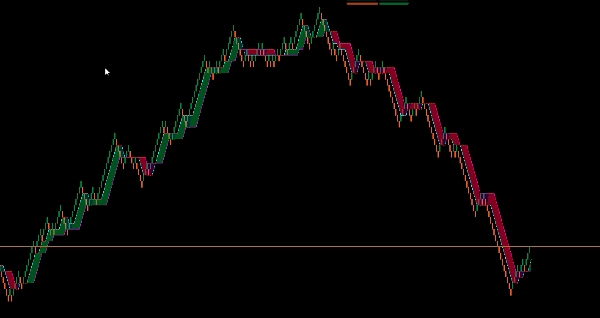
云(绿色/红色): 可视化趋势一致性——绿色表示快速趋势和慢速趋势均为看涨,红色表示两者均为看跌;在混合条件下,它保持在两线之间的中性基础状态,以避免强制偏向。
工作原理
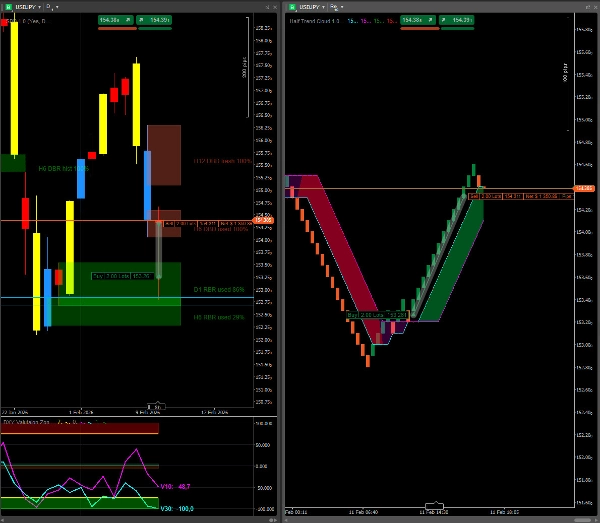
每个 Half Trend 使用可选择的高/低(或其他价格类型),并对选定的振幅/周期应用所选的移动平均平滑。趋势方向内部存储为趋势 = +1 / -1,而结果线则更新为当前动态水平。云运行两个 HalfTrend 实例(快速 + 慢速),并比较它们的趋势方向以决定绘制看涨还是看跌云。
参数
快速周期: 控制快速 Half Trend 的反应速度。
快速移动平均类型: 快速计算的平滑方法。
慢速周期: 控制过滤强度和确认。
慢速移动平均类型: 慢速计算的平滑方法。
策略附加(剥头皮 • 日内 • 摆动 • 突破)
核心规则: 仅当云对齐时交易方向——绿色做多,红色做空;避免在混合云条件下进行新交易。
剥头皮: 使用快速线进行时机判断;在慢速线保持支持时,逢快速线回调买入;当快速线反转并与云相反时退出或减仓。
日内交易: 将慢速线视为偏向线;仅在其方向上进行设置,并将快速线反转用作动量警告/退出触发。
摆动交易: 让慢速线定义趋势;在修正后使用快速线反转作为云重新对齐时的再入场时机。
突破: 优先选择云对齐时发生的突破;突破后,等待首次回调至快速线作为更干净的触发信号;当快速线和慢速线意见不合时跳过突破尝试。
使用其他指标以获得最佳入场点
摘要
Each Half Trend layer applies selectable price types (e.g., High/Low) and moving average smoothing over configurable amplitude/period settings. Trend direction is internally tracked as +1 or -1, with the cloud color determined by comparing the Fast and Slow trend directions.
Key parameters include Fast and Slow periods and their respective moving average types, allowing customization of reaction speed and noise filtering. The indicator supports multiple trading styles—scalping, day trading, swing trading, and breakout strategies—by using the Fast line for timing and the Slow line for bias and confirmation. It is applicable across various markets and symbols including Forex pairs (EURUSD, GBPUSD, USDJPY, NZDUSD), commodities (XAUUSD), indices (NAS100), and cryptocurrencies (BTCUSD).
Traders are advised to use the cloud alignment as a core rule for trade direction: green for long positions, red for short, and to avoid trades during mixed cloud conditions.
客户评价
5 | 50 % | |
4 | 50 % | |
3 | 0 % | |
2 | 0 % | |
1 | 0 % |


