
说明
Half Trend 指标旨在通过比较指定周期内的近期高点和低点来检测并突出潜在的趋势反转,然后相应地绘制“上升”或“下降”线。它可选择在每次趋势变化时绘制箭头,并且可以显示信号之间的点差。
- 高/低序列选择
- 该指标使用两个价格序列(默认是高价和低价)来跟踪局部最大值和最小值。
- 您可以通过最高价和最低价为每个序列选择不同的价格类型(例如,
开盘价、收盘价、中位价等)。
- 移动平均线及周期计算
- 基于所选的平滑类型和振幅周期,对所选的“高价”和“低价”价格序列均应用移动平均线。
- 指标将当前柱的价格与这些平滑后的高/低水平进行比较,以决定是否从上升趋势切换到下降趋势(或反之)。
- 趋势检测与绘制
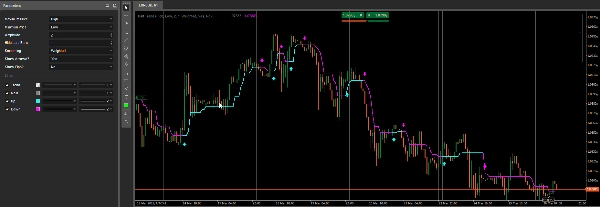
- 如果指标识别出上升趋势,则绘制上升线(青色)并将
Trend设置为+1。 - 如果检测到下降趋势,则绘制下降线(品红色)并将
Trend设置为-1。 - 主输出(灰色)会内部更新以反映当前的支撑/阻力水平。
Trend是一个不可见的输出序列,用于以数字形式存储趋势方向(+1或-1)。
- 如果指标识别出上升趋势,则绘制上升线(青色)并将
- 箭头及点差计算
- 显示箭头? – 如果启用,指标将在每个检测到趋势反转的新柱上绘制一个箭头。
- 显示点差? – 如果启用,它会计算并显示上一个信号与新信号之间的点差,在图表上绘制一个小标签和一条趋势线。
摘要
AI 摘要
The Half Trend BT indicator detects potential trend reversals by analyzing recent highs and lows over a specified period. It compares two selected price series—typically High and Low, but configurable to other price types such as Open, Close, or Median—using moving averages based on chosen smoothing methods and amplitude periods. The indicator plots an "Up" line (cyan) when an uptrend is detected and a "Down" line (magenta) for a downtrend, while internally storing trend direction numerically (+1 or -1). A main output line (gray) reflects current support and resistance levels. Optional features include drawing arrows on bars where trend reversals occur and calculating pip differences between signals, which are displayed as labels and trendlines on the chart. This indicator supports multiple markets including Forex, indices, commodities, cryptocurrencies, and stocks.
指标配置
客户评价
4.3
评价:3
5 | 33 % | |
4 | 67 % | |
3 | 0 % | |
2 | 0 % | |
1 | 0 % |
客户评价
March 29, 2025
Clean idea for traders around chart reading. The useful part is adding confirmation before a trade, with the numbers checked before scaling. The cleaner reads should hold across 3 sessions, not just 1 good chart. It is stronger when a 1.5R target is realistic before the entry.
March 28, 2025
March 28, 2025
Decent tool for testing if the trader wants it makes market context easier to scan. It works best as support, not a final decision maker. I would test it on 2 timeframes, 20 signals and a 1R stop plan. it should not be used as a blind entry trigger.
讨论
常见问答
Prop
Forex
Signal
Indices
Commodities
Crypto
Stocks
cTrader Store 提供的所有产品,包括交易机器人、指标和插件,均由第三方开发者提供,仅供信息参考和技术访问之用。cTrader Store 并非经纪商,不提供投资建议、个人推荐或任何未来业绩保证。


价格
48
销售
1.07K
免费安装