

说明
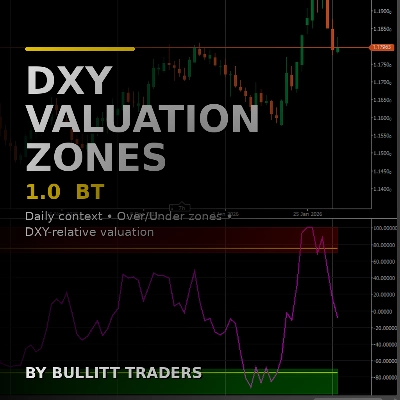
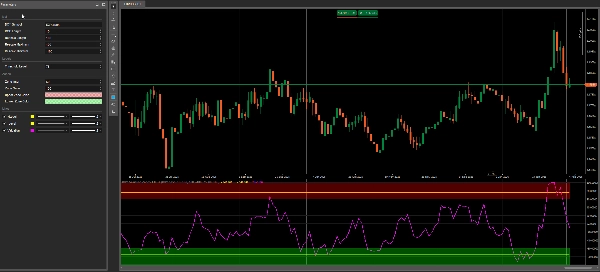
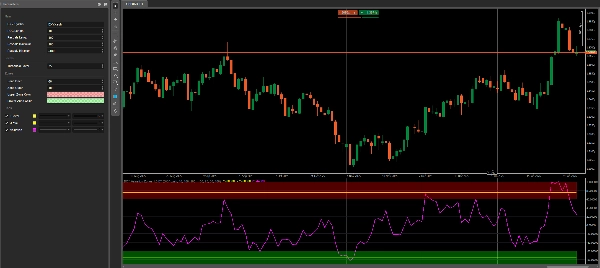
DXY 估值区间 1.0 BT 显示了一个清晰的 相对于 DXY 的估值线,用于您的图表符号,并突出显示两个简单的上下文区域:一个 超买区 和一个 超卖区。
它被构建为一个 日线(D1)上下文过滤器 — 无杂乱,只有清晰的区间 + 一个可配置的 ±阈值水平。
所有区间颜色使用原生 cTrader 颜色选择器,因此您可以通过调色板内的不透明度滑块直接控制透明度。
推荐用法(最佳于日线)
该指标在 美元相关货币对 上表现最佳,因为 DXY 代表广泛的美元强势。
示例:
- XXXUSD: EURUSD, GBPUSD, AUDUSD, NZDUSD
- USDXXX: USDJPY, USDCAD, USDCHF
快速开始(推荐默认设置)
- 时间框架: 日线(D1)
- 超买区: +70 … +100
- 超卖区: -70 … -100
- 阈值: ±75 (可调节)
- DXY 符号:
DXY.cash(或您经纪商的 DXY 名称)
工作原理(简单)
- 计算您的图表符号的 ROC(百分比变化)。
- 计算 DXY 的相同 ROC。
- 使用 差值(符号 ROC – DXY ROC)
- 将结果重新缩放到稳定的 -100 … +100 范围内。
如何解读
- 估值 > +阈值 → 拉伸 / “超买” 上下文
- 估值 < -阈值 → 拉伸 / “超卖” 上下文
- 介于两者之间 → 中性上下文
将其用作 偏向和位置过滤器,而非独立的入场信号。
重要(经纪商要求)
该指标需要经纪商提供的 DXY 符号(示例: DXY.cash)。
✅ 已在 FTMO 测试(可用性和命名可能因经纪商数据源而异)。
如果您的经纪商使用不同的名称,只需更改 DXY 符号 pa
摘要
AI 摘要
DXY Valuation Zones 1.0 BT is a daily timeframe indicator designed to provide a clear DXY-relative valuation line for any chart symbol. It highlights two key context areas: an Over Zone (+70 to +100) and an Under Zone (-70 to -100), with a configurable ±Threshold level (default ±75). The indicator calculates the rate of change (ROC) for both the selected symbol and the DXY (US Dollar Index), then uses their difference to produce a rescaled valuation value within a -100 to +100 range.
This tool is optimized for USD-related currency pairs, such as EURUSD, GBPUSD, AUDUSD, NZDUSD, USDJPY, USDCAD, and USDCHF, reflecting broad USD strength via the DXY. Zone colors are customizable using the native cTrader color picker, including transparency adjustments.
Traders can interpret values above the positive threshold as an "Over" or stretched context, values below the negative threshold as an "Under" context, and values in between as neutral. The indicator serves as a bias and location filter rather than a standalone entry signal. It requires a broker-provided DXY symbol (e.g., DXY.cash) to function properly.
This tool is optimized for USD-related currency pairs, such as EURUSD, GBPUSD, AUDUSD, NZDUSD, USDJPY, USDCAD, and USDCHF, reflecting broad USD strength via the DXY. Zone colors are customizable using the native cTrader color picker, including transparency adjustments.
Traders can interpret values above the positive threshold as an "Over" or stretched context, values below the negative threshold as an "Under" context, and values in between as neutral. The indicator serves as a bias and location filter rather than a standalone entry signal. It requires a broker-provided DXY symbol (e.g., DXY.cash) to function properly.
指标配置
客户评价
4.5
评价:4
5 | 50 % | |
4 | 50 % | |
3 | 0 % | |
2 | 0 % | |
1 | 0 % |
客户评价
February 10, 2026
The cleanest use is messy areas become easier to avoid. It works better with a written plan.
February 8, 2026
spread and slippage need a line in the notes, and it keeps the review from getting sloppy.
February 6, 2026
Tested small first and that felt like the right move, and Half size is enough at the start.
讨论
常见问答
Prop
Forex
Signal
cTrader Store 提供的所有产品,包括交易机器人、指标和插件,均由第三方开发者提供,仅供信息参考和技术访问之用。cTrader Store 并非经纪商,不提供投资建议、个人推荐或任何未来业绩保证。

























价格
51
销售
1.4K
免费安装