
说明
Hull 移动平均彩色版 – 一目了然的趋势方向
概述
Hull 移动平均彩色版是一种简化的趋势跟踪指标,结合了 Hull 移动平均的响应速度和颜色编码的方向信号。通过用绿色显示上升趋势,红色显示下降趋势,它无需复杂分析即可即时提供动量方向的视觉确认。
功能介绍
Hull 移动平均基础: 该指标使用 Hull 移动平均(HMA),这是一种快速反应的移动平均,旨在减少滞后同时保持平滑。与传统移动平均不同,HMA 优先考虑最近的价格动作,使其特别适合早期捕捉趋势变化。
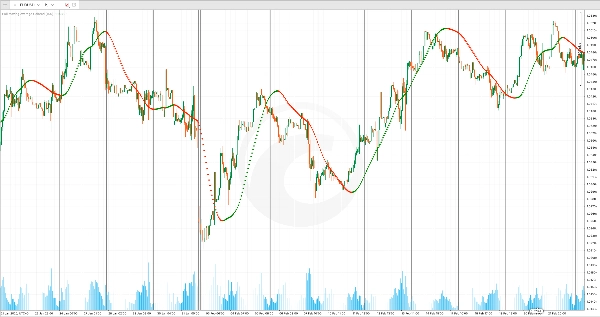
颜色编码的趋势可视化: 指标不是绘制单一线条,而是绘制方向点:
- 绿色点: 当 HMA 上升时出现,表示上升动量
- 红色点: 当 HMA 下降时出现,表示下降动量
这种二元颜色系统使趋势方向一目了然——无需解释斜率或与之前的柱状图比较。
主要特点
叠加显示: 指标直接绘制在价格图表上,让您可以看到趋势方向与实际价格水平的关系。这使得识别价格突破移动平均线的情况变得容易,提示潜在的进出场点。
响应滞后减少: Hull 移动平均比标准指数或简单移动平均反应更快,非常适合需要及时信号且避免过多震荡的波段交易者和日内交易者。
简单定制: 调整 周期参数 来控制灵敏度。较短周期(例如 20-32)使指标对近期走势更敏感,但在震荡市场中容易产生假信号。较长周期(例如 64-128)提供更平滑的趋势,减少假突破,但可能错过快速反转。
实际应用
将 Hull 移动平均彩色版用作交易方向的快速筛选器。仅当出现绿色点且价格高于均线时做多;仅当出现红色点且价格低于均线时做空。相反,将颜色变化视为潜在的退出信号——当绿色变为红色时,是重新评估多头头寸的时机。
该指标在趋势市场中表现良好,尤其适用于较高时间框架(4小时和日线),帮助您在交易较低时间框架设置前与更广泛的方向偏好保持一致。
摘要
AI 摘要
Hull Moving Average Colored is a technical indicator that enhances the traditional Hull Moving Average (HMA) by adding color-coded trend direction signals. The HMA itself is designed to reduce lag and improve responsiveness by emphasizing recent price movements through weighted moving averages, resulting in a smoother and faster-reacting trend line compared to standard moving averages.
This indicator overlays directly on price charts and uses a binary color system to indicate trend direction: green points appear when the HMA is rising, signaling upward momentum, and red points appear when the HMA is falling, signaling downward momentum. This visual approach allows traders to quickly identify trend direction without interpreting slopes or comparing previous bars.
Users can adjust the period parameter to control sensitivity—shorter periods increase responsiveness but may generate more false signals, while longer periods smooth trends but may delay signals. The indicator is suitable for various markets including Forex, indices, stocks, and cryptocurrencies such as BTCUSD and XAUUSD. It is particularly useful on higher timeframes (4-hour and daily) for aligning with broader market trends and can assist in identifying potential entry and exit points based on trend changes.
指标配置
客户评价
4.0
评价:1
5 | 0 % | |
4 | 100 % | |
3 | 0 % | |
2 | 0 % | |
1 | 0 % |
客户评价
April 24, 2025
ngl, direction is easier to respect and that is enough to keep testing it. H1 makes the signal less noisy.
讨论
常见问答
BTCUSD
Forex
Indices
EURUSD
GBPUSD
NZDUSD
Stocks
XAUUSD
NAS100
USDJPY
cTrader Store 提供的所有产品,包括交易机器人、指标和插件,均由第三方开发者提供,仅供信息参考和技术访问之用。cTrader Store 并非经纪商,不提供投资建议、个人推荐或任何未来业绩保证。


价格
12
销售
421
免费安装