说明
MFI-MTF:多时间框架资金流量指数
概述
MFI-MTF 是一种多时间框架动量指标,可为您当前的图表带来更高时间框架的视角。通过在更大时间框架上计算资金流量指数(MFI)并将其显示在您的工作图表上,该指标帮助您识别多个市场视角中的超买和超卖状况,无需手动切换时间框架。
功能介绍
资金流量指数分析: 该指标通过分析价格变动和交易量来衡量买卖压力。它在0到100之间波动,识别资产何时经历了过度买入(超买)或过度卖出(超卖)压力。
更高时间框架背景: MFIMTF不是在您当前的图表时间框架上计算MFI,而是从您指定的更大时间框架(每日、每周、4小时等)提取数据。这为您提供了机构级别的动量洞察,避免了较低时间框架的噪音。例如,当每日MFI显示超买状况时,您就知道更大趋势正在接近疲软——这对进出场决策非常有价值。
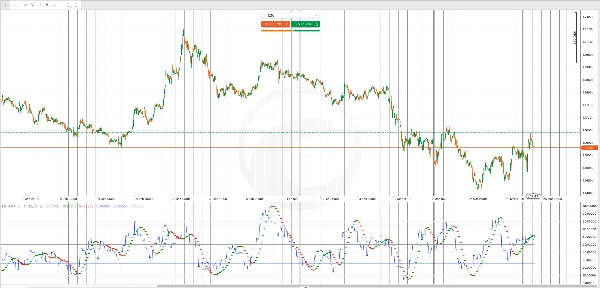
Hull移动平均滤波器: 应用于MFI的Hull移动平均(HMA)平滑了震荡,突出显示方向性动量变化。绿色点标记动量上升趋势,红色点标记动量下降趋势,为您快速视觉确认动量方向变化。
主要输出
MFI线(蓝色): 来自您选择的更高时间框架的主要资金流量指数值,显示在您当前图表的每个柱上。
HMA信号(绿色/红色点): 当动量增强向上时出现绿色点;当动量减弱或反转向下时出现红色点。这些作为潜在转折的早期警告信号。
参考水平:
- 超买水平(默认70): 当MFI超过此值时,买入压力过大,反转可能性增加
- 超卖水平(默认30): 当MFI低于此值时,卖出压力耗尽,反弹可能性增加
- 中线(50): 多空动量之间的中性平衡点
自定义
时间框架选择: 选择比您当前图表更高的任何时间框架(例如,在1小时图上选择每日)。较大的时间框架提供更广泛的趋势背景,但信号较少;较小的时间增量提供更多交易机会,但战略视角较弱。
MFI周期: 调整资金流量指数的回溯周期(默认14)。较短周期使指标对近期成交量变化更敏感;较长周期平滑波动,减少假信号。
HMA周期: 控制动量滤波器的平滑程度。较短周期使趋势变化更明显但噪音更大;较长周期更可靠地确认趋势,但信号生成较慢。
超买/超卖阈值: 根据您的交易风格自定义这些水平。保守交易者可能使用75/25;激进交易者可能使用80/20以等待更极端的条件。
实际应用
使用MFI MTF为您的进出场增加共识。如果每日MFI已处于超买状态,您当前时间框架的卖出信号将更可靠,表明机构卖家可能正在活跃。同样,当更高时间框架的MFI处于超卖状态时,买入信号会更强,显示宏观层面卖压已耗尽。
HMA颜色变化为您提供动量变化的实时警报,帮助您提前退出亏损交易或在反转变得严重之前减少仓位。
摘要
The indicator includes a Hull Moving Average (HMA) filter applied to the MFI to smooth out noise and highlight momentum shifts. Green dots indicate strengthening upward momentum, while red dots signal weakening or downward momentum. Reference levels include default overbought (70), oversold (30), and a neutral midpoint (50), all customizable to fit different trading styles.
Key outputs are the MFI line from the chosen higher timeframe and HMA signals for momentum direction changes. Adjustable parameters include the MFI lookback period, HMA smoothing period, and overbought/oversold thresholds. MFI-MTF aids in confirming entry and exit points by providing institutional-level momentum insights and real-time alerts to momentum shifts on your working chart.
客户评价
5 | 100 % | |
4 | 0 % | |
3 | 0 % | |
2 | 0 % | |
1 | 0 % |