
说明
Bullitt Traders 的 Camarilla — 可视化结构。精准交易。
一款专业级的 cTrader Camarilla 支点指标,旨在揭示价格如何围绕机构水平反应。
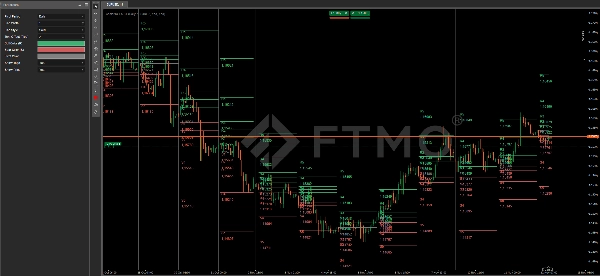
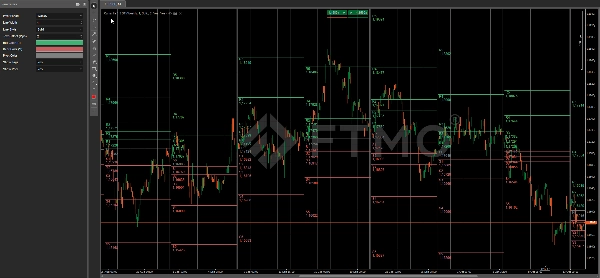
它会自动绘制所有关键的 Camarilla 水平(R1–R5 / S1–S5)和多个时间框架的支点——为交易者提供清晰的结构图,便于识别反转和突破。
主要特点
- ✅ 真实的 Camarilla 公式 — 根据前一周期的最高价、最低价和收盘价计算水平。
- 📊 多时间框架逻辑 — 可选择每日、每周或每月的支点周期。
- 🕒 历史映射 — 自动绘制过去周期,提供视觉上下文和结构分析。
- 🎨 自定义样式 — 可根据行情状态(看涨、看跌、中性)调整线条宽度、样式和颜色。
- 💬 标签与价格 — 可切换文本和数值显示,布局简洁或详细。
- ⚡ 轻量且无重绘 — 针对任何品种优化速度和准确性。
- 🧩 适用于所有图表类型 — 支持时间、范围、Tick 和 Renko 图表。
Camarilla 水平
R5 – 极端突破目标区
R4 – 主要阻力,潜在突破触发点
R3 – 上方反转区,常用于做空入场
R2 – 中级阻力
R1 – 初始阻力,早期反应水平
PP – 中心支点(均值回归区)
S1 – 初始支撑,早期反应水平
S2 – 中级支撑
S3 – 下方反转区,常用于做多入场
S4 – 主要支撑,潜在突破触发点
S5 – 极端突破目标区
参数
支点周期 – 选择每日、每周或每月进行水平计算
线宽 – 调整整体线条粗细
线条样式 – 设置实线、点线或虚线
文本偏移(点数) – 线条与标签之间的距离
多头颜色(R) – 阻力水平(R1–R5)的颜色
空头颜色(S) – 支撑水平(S1–S5)的颜色
支点颜色 – 中心支点线(PP)的颜色
显示标签 – 显示或隐藏阻力/支撑水平名称
显示价格 – 显示或隐藏数值价格标签
使用方法
R3–S3 区域 → 典型的日内反转区域
R4–S4 水平 → 突破或延续确认
R5–S5 → 高波动目标和耗尽区
摘要
AI 摘要
Camarilla 1.5 BT is a professional-grade pivot indicator designed for the cTrader platform. It calculates and displays Camarilla pivot levels (R1–R5, S1–S5) and the central pivot point (PP) based on the previous period’s high, low, and close prices. The indicator supports multiple timeframes—Daily, Weekly, and Monthly—allowing traders to analyze price reactions around institutional levels across different periods.
Key features include automatic plotting of historical pivot levels for context, customizable line width, style, and colors for bullish, bearish, and neutral regimes, and options to show or hide level labels and price values. The indicator is lightweight, non-repainting, and compatible with various chart types such as time, range, tick, and Renko charts.
Camarilla levels serve specific roles: R3–S3 zones indicate typical intraday reversal areas; R4–S4 levels suggest breakout or continuation confirmations; and R5–S5 mark extreme breakout targets and high-volatility exhaustion zones. This tool provides a clear structural map to assist traders in identifying potential reversals, breakouts, and target zones across multiple markets including Forex, indices, commodities, cryptocurrencies, and stocks.
指标配置
客户评价
5.0
评价:2
5 | 100 % | |
4 | 0 % | |
3 | 0 % | |
2 | 0 % | |
1 | 0 % |
客户评价
March 26, 2026
Does what it says on the tin. An excellent product. The owner took less than 24h to fix an issue, superb service.
February 9, 2026
Camarilla 1.5 BT delivers clean and accurate Camarilla pivot levels for intraday trading. Levels update correctly and remain easy to read across timeframes. Great for mean-reversion setups, reaction zones and trade planning. A solid, lightweight tool that fits perfectly into price-action and level-based strategies.
讨论
常见问答
Prop
Forex
Indices
Commodities
Crypto
Stocks
cTrader Store 提供的所有产品,包括交易机器人、指标和插件,均由第三方开发者提供,仅供信息参考和技术访问之用。cTrader Store 并非经纪商,不提供投资建议、个人推荐或任何未来业绩保证。


价格
48
销售
1.05K
免费安装