
说明
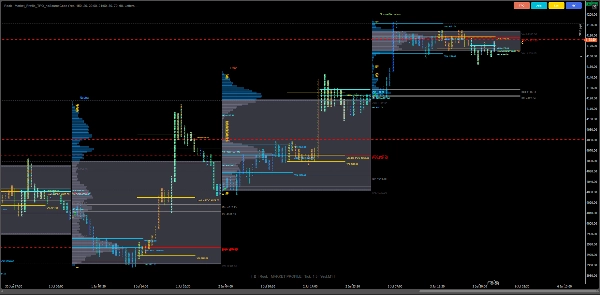
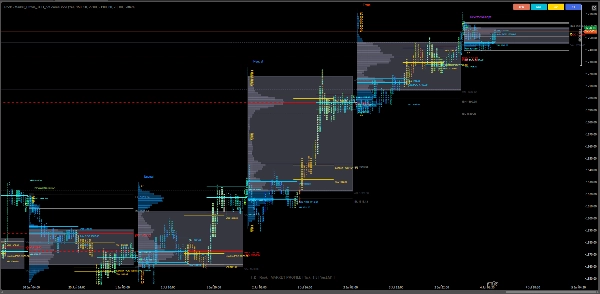
市场剖面TPO(时间价格机会)为cTrader带来机构级市场结构可视化——使交易者能够在一个智能视图中看到价格、时间和成交量如何在各个交易时段交互。
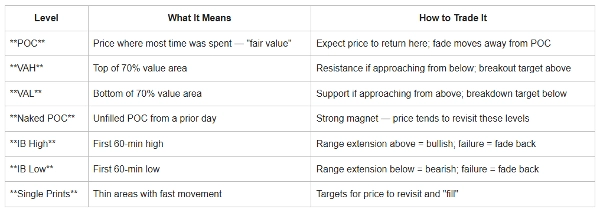
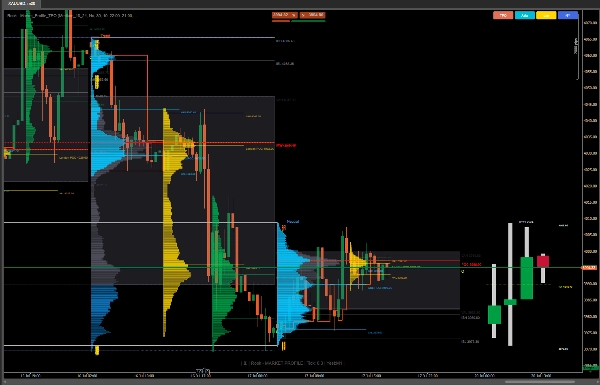
该指标专为专业日内交易者、拍卖市场分析师和订单流爱好者设计,使用TPO字母、方框和直方图,提供市场活动的真实表现。它帮助您精准识别价值区、POC区域、初始平衡范围和裸水平。
⚙️ 核心功能
✅ (TPO) 可视化
✅ POC 和价值区区域
✅ 发展中的POC
✅ 初始平衡(IB)检测
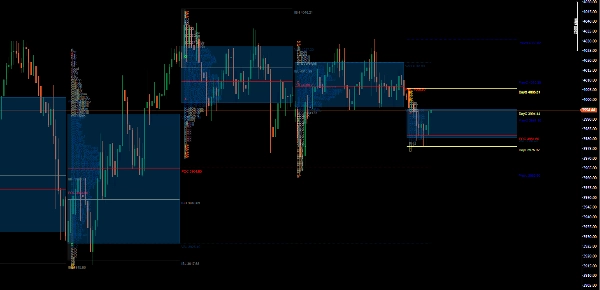
✅ 交易时段和时区智能
✅ TPO显示模式(字母 / 直方图)
✅ 开盘/收盘价格标记(O/X)
✅ 单一打印和裸POC/VA水平
✅ 当日及前一日OHLC叠加
✅ 当日及前一日OHLC叠加
✅ 高时间框架条形投影(AMD)
主要改进
✔ 加载更快
✔ 更好的内存管理
✔ 精准的价值区计算
✔ 正确的交易时段剖面定位
✔ 更佳的切换性能
✔ 跨平台兼容性
✔ 基于UTC的交易时段(无自动夏令时调整)
✔ 改进的裸POC处理
✔ 改进的剖面渲染
🧭 交易使用案例
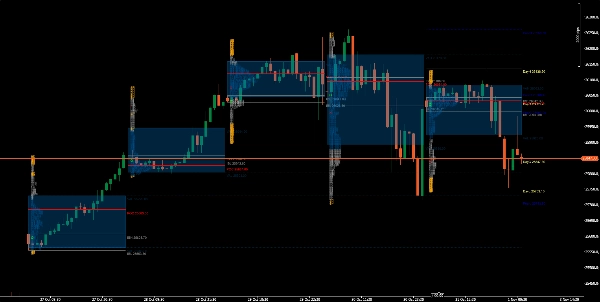
🔹 日内拍卖分析 — 识别价值形成、迁移或破裂的位置。
🔹 POC 和价值回归交易 — 目标均衡重测或极端回撤。
🔹 初始平衡突破 — 发现交易时段超出首小时范围的情况。
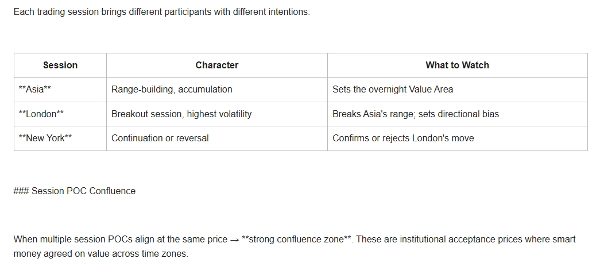
🔹 交易时段轮换研究 — 比较亚洲、伦敦和纽约交易时段的剖面并进行时区对齐。
🔹 机构背景构建 — 结合成交量或增量工具验证智能资金足迹。
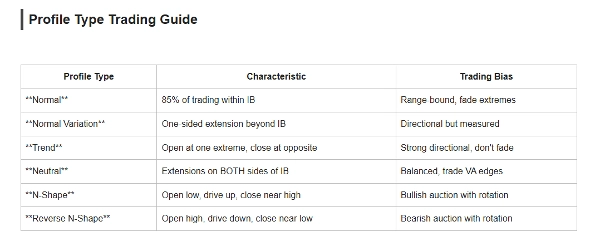
剖面类型
类型 市场状况
正常 平衡市场
正常变体 中等趋势
趋势 强烈定向日
中性 双边拍卖
N形 看涨拍卖
反向N形 看跌拍卖
适合于
- 拍卖市场理论(AMT)
- 市场剖面交易者
- 日内交易者
- 波段交易者
- 期货交易者
- 外汇交易者
- 专业订单流分析
为您的图表带来机构级清晰度。
市场剖面TPO指标将原始价格数据转化为价值、不平衡和机会的故事
免责声明: 本指标仅供教育和信息用途,不构成财务、投资或交易建议。市场剖面是一种分析工具,不保证利润或未来结果。
金融市场交易涉及重大风险,过去的表现不保证未来结果。用户对其交易决策、风险管理及由此产生的利润或亏损负全责。
在做出投资或交易决策前,请务必自行分析并咨询合格的金融专业人士。
摘要
Key features include multiple TPO display modes (letters and histogram), session and timezone intelligence with UTC-based sessions, open/close price markers (O/X), single prints, naked POC/VA levels, and overlays of day and previous day OHLC data. The indicator supports analysis of various market conditions through profile types like Normal (balanced market), Normal Variation (moderate trend), Trend (strong directional day), Neutral (two-sided auction), N-Shape (bullish auction), and Reverse N-Shape (bearish auction).
It is suitable for professional day traders, auction market analysts, order flow enthusiasts, and traders across Forex, indices, and commodities markets. Typical use cases include intraday auction analysis, POC and value reversion trades, initial balance breakouts, session rotation studies, and institutional context building when combined with volume or delta tools.
This indicator provides a detailed, structured view of market dynamics to support informed trading decisions based on Auction Market Theory and Market Profile principles.
客户评价
5 | 0 % | |
4 | 100 % | |
3 | 0 % | |
2 | 0 % | |
1 | 0 % |


