OR Session Zones
Indicador
Versión 1.1, Dec 2025
Windows, Mac
4.5
Valoraciones: 2
Descripción
Zonas de sesión OR — Indicador de rango de apertura multi-sesión
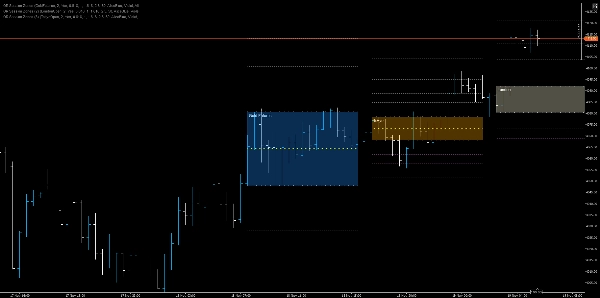
Un indicador de rango de apertura de alta precisión que detecta aperturas de sesión (NY, Londres, UE, Tokio, Shanghái, futuros de oro/petróleo), dibuja zonas dinámicas de máximo/mínimo/medio OR, proyecta objetivos basados en Fibonacci y pinta un área sombreada configurable para una decisión visual rápida.
Características clave
- Detección multi-sesión: Soporte nativo para barras de apertura de Nueva York, Londres, EuroNext, Tokio, Shanghái, futuros de oro y futuros de petróleo usando indicadores de sesión dedicados.
- Cálculo del rango de apertura: Calcula el máximo y mínimo OR a partir de un número configurable de velas (RangeCandles) y registra la hora de inicio de la sesión.
- Superposiciones persistentes en el gráfico: Dibuja líneas de tendencia para el máximo OR, mínimo OR y medio OR (50%) a lo largo del gráfico hasta un tiempo de extensión configurable.
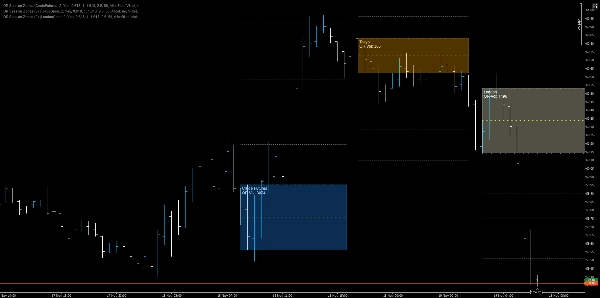
- Zona sombreada: Rectángulo relleno entre el máximo OR y el mínimo OR con opacidad y color configurables por sesión para un contexto visual instantáneo.
- Proyecciones de Fibonacci: Hasta cuatro líneas de proyección R (resistencia) y S (soporte) derivadas del rango OR con colores independientes y opacidad ajustable.
- Visibilidad flexible: Opción para ocultar o mostrar IDs de objetos indexados (únicos) para evitar colisiones; soporta tanto objetos persistentes únicos como objetos por barra cuando se activa Ocultar.
- Codificación de color por sesión: Cada sesión usa un esquema de color distinto (por ejemplo, DodgerBlue, LightYellow, Orange, OrangeRed) para que el origen de la sesión sea inmediatamente obvio.
Cómo ayuda a los traders
- Contexto rápido: Ver instantáneamente dónde abrió el mercado para una sesión principal y entender la estructura temprana del rango sin medición manual.
- Disparadores de decisión: Usar rupturas OR, rechazos en la línea media y proyecciones de Fibonacci como reglas de entrada/salida o anclas para colocación de stops.
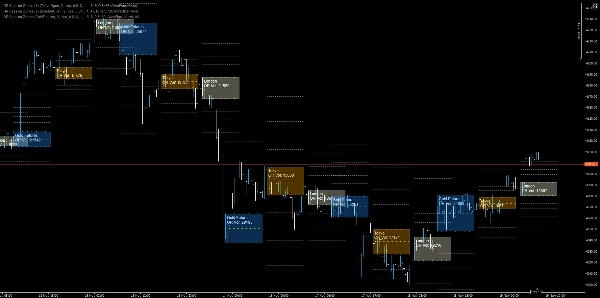
- Estrategia multi-sesión: Combinar ORs superpuestos (por ejemplo, Londres + NY) para detectar zonas de confluencia de sesión y áreas de trading con mayor probabilidad.
- Gestión de riesgo: Colocar stops detrás de pilas OR o usar el 50% medio como objetivos dinámicos de stop/take.
Escenarios de uso y reglas de ejemplo
- Entrada por ruptura: Comprar al cierre por encima del máximo OR con confirmación de volumen o momentum; stop justo debajo del máximo OR (o del medio OR para salidas más ajustadas).
- Operar en contra de la apertura: Corto cerca del máximo OR con confirmación de reversión si el precio no se sostiene por encima del medio OR y muestra una rápida retirada de ofertas.
- Trading en confluencia de sesiones: Cuando los OR de Londres y NY se superponen, tratar la superposición como una zona de oferta/demanda de alta confianza y ajustar el tamaño de posición en consecuencia.
- Objetivos de proyección: Usar R1/R2/R3/R4 como niveles escalonados de toma de ganancias y S1 - S4 simétricamente para objetivos a la baja.
Resumen
Perfil del indicador
Valoraciones de clientes
4.5
Valoraciones: 2
5 | 50 % | |
4 | 50 % | |
3 | 0 % | |
2 | 0 % | |
1 | 0 % |
Valoraciones de clientes
November 22, 2025
Solid enough as a backup opinion, and It can look better than it is during a lucky run.
November 19, 2025
Conversación
Preguntas frecuentes
Fibonacci
Forex
Breakout
Indices
EURUSD
Commodities
GBPUSD
XAUUSD
NAS100
Los productos disponibles a través de cTrader Store, incluidos bots, indicadores y plugins para operar, son proporcionados por desarrolladores de terceros y están disponibles únicamente con fines informativos y de acceso técnico. cTrader Store no es un bróker, por lo que no proporciona asesoramiento de inversión, recomendaciones personales ni ninguna garantía de rentabilidad futura.


Precio
26
Ventas
2.15K
Instalaciones gratis