Opis
🎯 WIELOKROTNA INTELIGENCJA ZMIENNOŚCI NA RÓŻNYCH INTERWAŁACH CZASOWYCH
Przestań przegapiać wybicia zmienności - zobacz wszystkie interwały jednocześnie
Większość wskaźników zmienności pokazuje tylko jedną perspektywę. Nasz Wskaźnik Zmienności Kroczącej na Wielu Interwałach Czasowych daje pełny obraz w krótkim (7), średnim (21) i długim (63) okresie - z wbudowanymi sygnałami handlowymi , które dokładnie wskazują, kiedy działać.
⚡ DLACZEGO WIELOKROTNA ZMIENNOŚĆ ZMIENIA WSZYSTKO
Pojedynczy interwał vs nasze podejście wielointerwałowe:
- ❌ Pojedynczy okres: Widzisz drzewa, ale tracisz las
- ✅ Trzy okresy: Kompletny krajobraz zmienności z kontekstem
Rzeczywiste scenariusze handlowe:
- Krótkoterminowy skok podczas długoterminowego spokoju → Tymczasowy szum (ignoruj)
- Wszystkie interwały rosną → Prawdziwa zmiana reżimu (działaj)
- Krótkoterminowy spokój wśród długoterminowego chaosu → Fałszywy spokój (ostrożność)
🎯 FUNKCJE PROFESJONALNE
✨ WIDOCZNOŚĆ NA TRZECH INTERWAŁACH CZASOWYCH
- StdDev 7: Wykrywaj natychmiastowe zmiany zmienności (intraday)
- StdDev 21: Zmienność średnioterminowa (swing trading)
- StdDev 63: Kontekst zmienności długoterminowej (position trading)
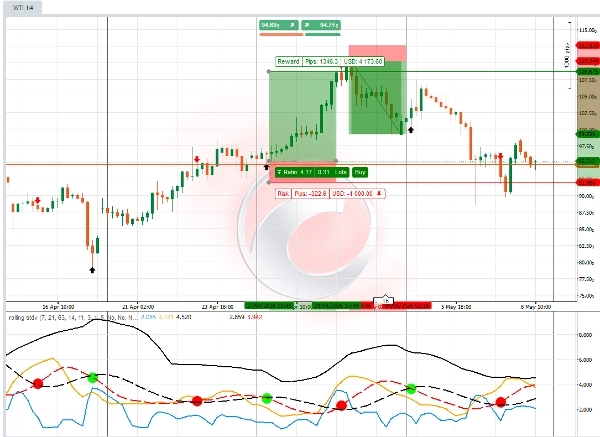
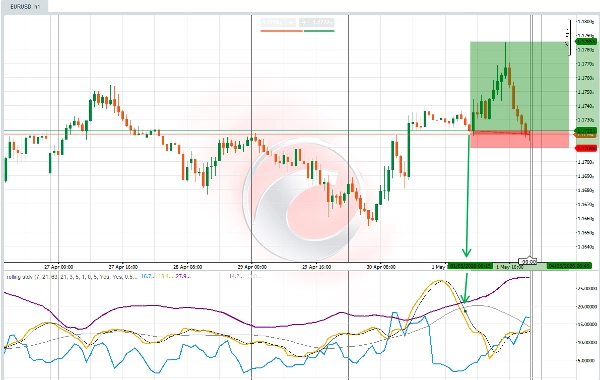
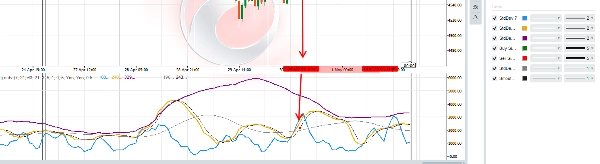
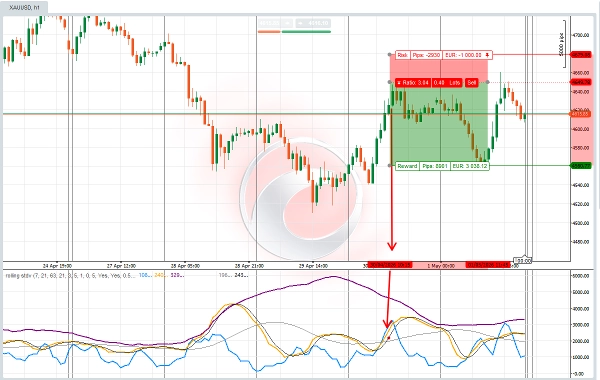
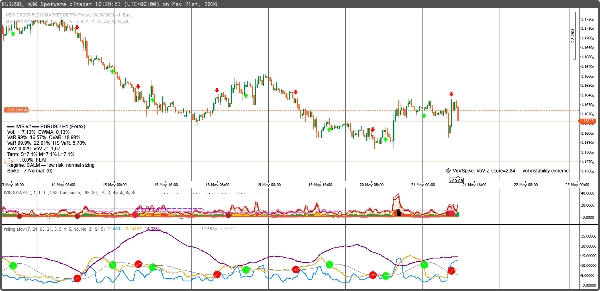
- Sygnał oscylatora: gdy średnie linie sygnału Kroczącej Odchylenia Standardowego się przecinają, które kolorowe kropki potwierdzają wyższą i niższą zmienność oraz kierunek ruchu ceny. Przy dużym sygnale Czerwonej-KROPKI, Zielonej-KROPKI, Trader zobaczy również sygnał Czerwonej-Strzałki, Zielonej-Strzałki na wykresie, co może pomóc w decyzji o poziomach wejścia i wielkości transakcji.
- Kroczące Odchylenie Standardowe to oscylator zmienności z predykcyjną logiką sygnałów rynkowych. Parametry na panelu muszą być sprawdzone i dostosowane do typu instrumentu CFD, którym trader chce handlować. Każdy instrument CFD na aktywa finansowe może mieć nieco inne ustawienia na panelu. Traderzy mogą wybrać dokładność i precyzję odczytów zmienności, aktywując: Nachylenie, szybki/średni sygnał przecięcia oraz wygładzanie.
📊 ZALETY ANALIZY ZMIENNOŚCI
- Przecięcia zmienności: Przecięcia linii StdDev = zmiany reżimu
- Sygnały powrotu do średniej: Zmienność wraca do średniej
- Wykrywanie skoków: Ekstremalne zdarzenia zmienności
💡 IDEALNE DLA TYCH STYLÓW HANDLOWYCH:
🎯 Traderzy wybicia zmienności
- Wejście podczas niskiej zmienności przed wybuchowymi ruchami
- Wyjście podczas wysokiej zmienności przed odwróceniami
- Precyzyjne wyznaczanie momentów wejścia dzięki potrójnemu potwierdzeniu
📈 Traderzy powrotu do średniej
- Pewne wykorzystanie ekstremów zmienności
- Identyfikacja nadmiernie rozciągniętych warunków rynkowych
- Wykorzystanie zmienności jako wskaźnika kontrariańskiego
🛡 Traderzy unikający ryzyka
- Całkowite unikanie okresów wysokiej zmienności
- Handel tylko podczas spokojnych, przewidywalnych rynków
- Wykorzystanie zmienności jako przewodnika do ustalania wielkości pozycji
📊 Traderzy opcji
- Sprzedaż premii czasowej podczas wysokiej zmienności
- Kupno opcji podczas kompresji zmienności
- Analiza IV vs HV dla błędów wyceny
Wbudowane inteligentne sygnały:
- ✅ Kupuj gdy: Zmienność spada poniżej progu LUB przecina się poniżej średniej kroczącej
- ✅ Sprzedawaj gdy: Zmienność gwałtownie rośnie powyżej progu LUB przecina się powyżej średniej kroczącej
📈 CO OTRZYMUJESZ:
✅ Widoczność na trzech interwałach czasowych - Koniec zgadywania kontekstu zmienności
✅ Automatyczne sygnały kupna/sprzedaży - Wyraźne wizualne strzałki w optymalnych punktach
✅ Wykrywanie reżimu zmienności - Wiedza, kiedy rynki są spokojne lub chaotyczne
✅ Dostosowywalne progi - Dopasuj do każdego stylu handlu lub aktywów
✅ Profesjonalne kodowanie kolorów - Natychmiastowe wizualne zrozumienie
💰 SPECJALNA CENA STARTOWA: 50 USD
(Regularna cena: 100 USD)
Podział wartości:
- Wskaźnik StdDev 7: wartość 29 USD
- Wskaźnik StdDev 21: wartość 29 USD
- Wskaźnik StdDev 63: wartość 29 USD
- Sygnały handlowe: wartość 49 USD
- Łączna wartość: 136 USD
- Twoja cena: 50 USD (oszczędzasz 35%)
W zestawie: Pełny wskaźnik Kolor
🎁 BONUS: Darmowy przewodnik po timingach zmienności
Zakup zawiera "Mistrzostwo Zmienności na Wielu Interwałach" - darmowa wartość 39 USD.
Zawiera:
- Strategie handlu kompresją zmienności
- Techniki potwierdzenia na wielu interwałach
- Zarządzanie ryzykiem w okresach zmienności
- Przykłady transakcji z rzeczywistego świata
🚀 GOTOWY, BY OPANOWAĆ TIMING ZMIENNOŚCI?
Kliknij "Dodaj do koszyka" i zmień sposób, w jaki widzisz i handlujesz zmiennością rynku.
"Próbowałem wszystkich wskaźników zmienności. To podejście na trzech interwałach z wbudowanymi sygnałami to coś, czego używam codziennie w handlu w firmie prop tradingowej."
- Sarah Rodriguez, profesjonalna traderka swingowa
IDEALNE DLA TYCH RYNKÓW:
📊 Akcje i ETF-y
- Timing zmienności SPY, QQQ
- Rotacja sektorów oparta na zmienności
- Strategie zmienności wyników finansowych
💹 Pary walutowe Forex
- Analiza zmienności głównych par
- Ocena ryzyka carry trade
- Potwierdzenie wybicia
📈 Surowce
- Cykl zmienności złota
- Skoki zmienności ropy
- Sezonowa zmienność w rolnictwie
🔄 Kryptowaluty
- Reżimy zmienności BTC/ETH
- Możliwości zmienności altcoinów
- Zarządzanie ryzykiem w kryptowalutach
Podsumowanie: To nie jest zwykły wskaźnik odchylenia standardowego. To kompletny system timingowy zmienności, który pokazuje dokładnie, kiedy rynki mają się poruszyć.
Oferta limitowana na start: Pierwsze 150 kopii po 89 USD (oszczędzasz 30 USD)
"Różnica między amatorem a profesjonalnym handlem często sprowadza się do timingu zmienności. Ten wskaźnik tę lukę zamyka."
Dodaj do koszyka teraz → Zacznij handlować zmiennością jak profesjonalista.
Podsumowanie
Key features include:
- Triple timeframe visibility for immediate, swing, and position trading contexts.
- Volatility crossovers signaling regime shifts.
- Mean reversion and spike detection for volatility extremes.
- Customizable parameters to adapt to different CFD instruments and trading styles.
- Professional color-coded signals for quick interpretation.
This indicator suits various trading styles, including volatility breakout, mean reversion, risk-averse, and options trading. It supports multiple markets such as stocks, ETFs, forex pairs, commodities, and cryptocurrencies, providing volatility timing insights for assets like SPY, QQQ, gold, oil, BTC, and ETH.
Included with the indicator is a volatility timing guide covering compression strategies, multi-timeframe confirmation, risk management, and real trade examples. The tool requires tick data and outputs actionable signals to enhance volatility-based trading decisions.
Opinie klientów
5 | 50 % | |
4 | 50 % | |
3 | 0 % | |
2 | 0 % | |
1 | 0 % |