
Opis
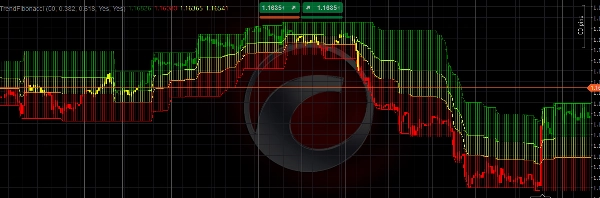
Wskaźnik TrendFibonacci został zaprojektowany, aby pomóc traderom precyzyjnie identyfikować kluczowe poziomy cenowe i trendy rynkowe. Poprzez integrację poziomów zniesienia Fibonacciego z ważoną średnią kroczącą (WMA) oraz średnim rzeczywistym zakresem (ATR), wskaźnik ten zapewnia wyraźną, wizualną reprezentację wsparcia, oporu oraz kierunku trendu.
Kluczowe cechy:
- Dynamiczne poziomy Fibonacciego: Automatycznie oblicza i rysuje poziomy zniesienia Fibonacciego (domyślnie: 0,382 i 0,618) na podstawie najwyższego maksimum i najniższego minimum w okresie zwrotnym zdefiniowanym przez użytkownika.
- Ważona średnia krocząca (WMA): Używa 6-okresowej WMA do oceny kierunku trendu, z kolorowymi świecami (zielone dla trendu wzrostowego, czerwone dla spadkowego, żółte dla neutralnego), które odzwierciedlają pozycję WMA względem poziomów Fibonacciego.
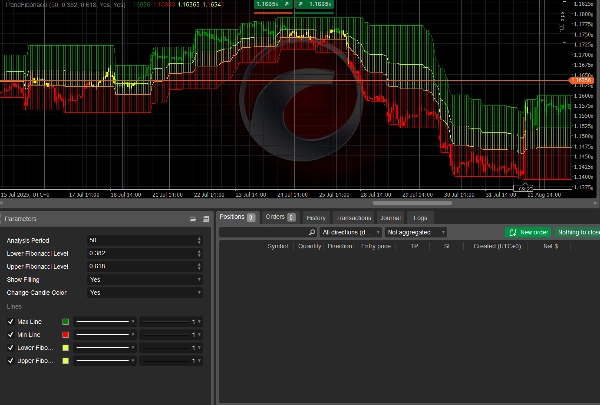
- Dostosowywane parametry: Możliwość regulacji okresu analizy, poziomów Fibonacciego oraz włączania/wyłączania funkcji takich jak wypełnione strefy i zmiana koloru świec.
- Przejrzystość wizualna: Rysuje linie maksimum/minimum oraz wypełnia obszary między poziomami Fibonacciego półprzezroczystymi kolorami dla łatwej identyfikacji trendu.
- Integracja ATR: Zawiera 200-okresowy ATR dla solidnej analizy rynku, zapewniając adaptację do zmienności.
Ten wskaźnik jest idealny dla traderów, którzy chcą łączyć analizę Fibonacciego ze strategiami podążania za trendem. Niezależnie od tego, czy handlujesz na rynku forex, akcjami czy towarami, TrendFibonacci zwiększa Twoją zdolność do wykrywania kluczowych stref odwrócenia i podejmowania świadomych decyzji handlowych.
Jak korzystać
- Zainstaluj wskaźnik:
-
- Dodaj wskaźnik TrendFibonacci do platformy cTrader, przesyłając kod źródłowy lub pobierając go z marketplace.
- Skonfiguruj parametry:
-
- Okres analizy: Ustaw okres zwrotny (domyślnie: 50 świec), aby określić zakres do obliczania cen maksimum/minimum.
- Dolny poziom Fibonacciego: Dostosuj dolny poziom zniesienia Fibonacciego (domyślnie: 0,382).
- Górny poziom Fibonacciego: Dostosuj górny poziom zniesienia Fibonacciego (domyślnie: 0,618).
- Pokaż wypełnienie: Włącz/wyłącz wypełnione strefy między poziomami Fibonacciego (domyślnie: włączone).
- Zmień kolor świecy: Włącz/wyłącz kolorowe świece na podstawie pozycji WMA (domyślnie: włączone).
- Interpretuj wskaźnik:
-
- Zielone świece: Wskazują trend wzrostowy, gdy WMA znajduje się powyżej górnego poziomu Fibonacciego.
- Czerwone świece: Sygnalizują trend spadkowy, gdy WMA jest poniżej dolnego poziomu Fibonacciego.
- Żółte świece: Sugerują strefę neutralną, gdy WMA znajduje się pomiędzy poziomami Fibonacciego.
- Wypełnione strefy: Wizualizują kluczowe strefy cenowe między liniami maksimum/minimum a poziomami Fibonacciego dla analizy wsparcia/oporu.
- Zastosowanie w handlu:
-
- Używaj wskaźnika do identyfikacji potencjalnych punktów wejścia/wyjścia na poziomach Fibonacciego.
- Łącz z innymi narzędziami technicznymi (np. RSI, MACD) dla potwierdzenia.
- Monitoruj kolorowe świece, aby ocenić siłę i kierunek trendu.
- Najlepsze praktyki:
-
- Testuj wskaźnik na koncie demo, aby zapoznać się z jego działaniem.
- Dostosuj parametry do swojego stylu handlu i warunków rynkowych.
- Stosuj na wyższych interwałach czasowych (np. H1, H4) dla bardziej wiarygodnych sygnałów.
Wskaźnik TrendFibonacci to wszechstronne narzędzie dla traderów na każdym poziomie zaawansowania, oferujące jasne, praktyczne wskazówki dotyczące trendów rynkowych i poziomów cenowych.
Podsumowanie
Users can customize parameters such as the analysis period, Fibonacci levels, and visual features like filled zones between Fibonacci levels and candle color changes. The indicator visually highlights support and resistance zones by plotting high/low lines and filling areas between Fibonacci levels with semi-transparent colors. It is applicable across various markets including forex, stocks, commodities, and popular symbols like BTCUSD, EURUSD, GBPUSD, and XAUUSD.
TrendFibonacci supports traders in spotting potential entry and exit points at Fibonacci levels and can be combined with other technical tools like RSI and MACD for confirmation. It is recommended for use on higher timeframes (e.g., H1, H4) to enhance signal reliability.


![Logo „[Hamster-Coder] Price”](https://cdn.ctrader.com/image/webp/893fb641-d5b3-44d8-91fb-6a2dc6f3d309_30647)