
Opis
Wskaźnik MAGIC BLOCK STRATEGY łączy dwa główne podejścia do analizy rynku:
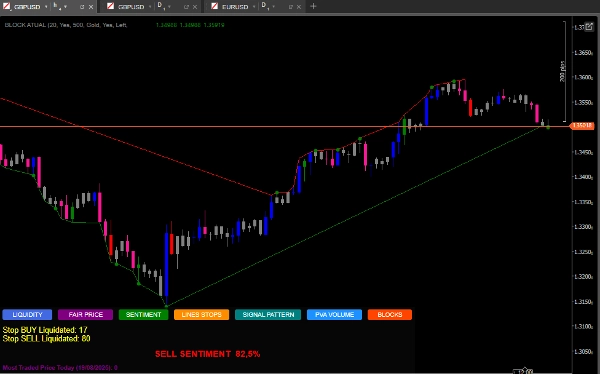
Wykrywanie bloków zleceń:
Identyfikuje obszary wsparcia i oporu na podstawie nieprzerwanych maksimów i minimów w okresie analizy wstecznej.
Generuje sygnały kupna, gdy cena zamyka się powyżej nieprzerwanego minimum.
Generuje sygnały sprzedaży, gdy cena zamyka się poniżej nieprzerwanego maksimum.
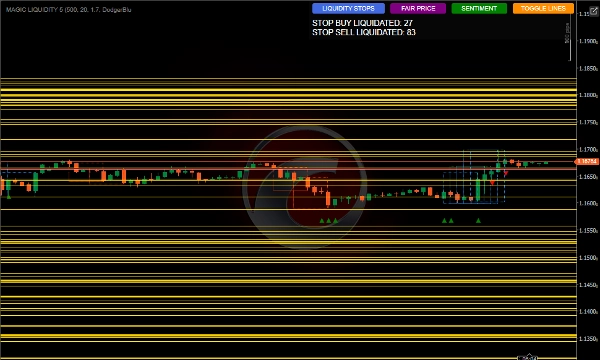
Analiza płynności:
Wykrywa obszary skupisk płynności, gdzie mogą być skoncentrowane zlecenia stop loss.
Monitoruje aktywację zleceń stop kupna i sprzedaży.
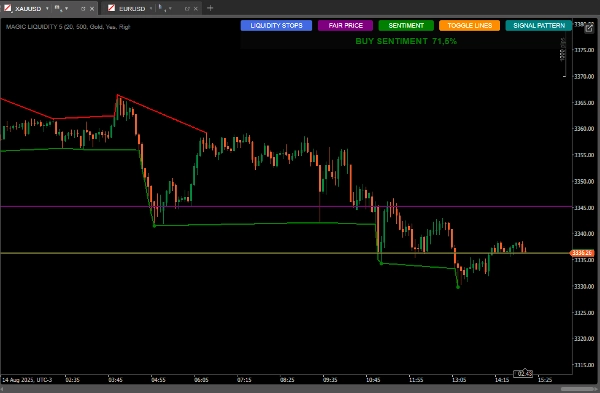
Oblicza sentyment rynku na podstawie rozkładu płynności.
Identyfikuje najczęściej handlowaną uczciwą cenę.
Jak używać dla najlepszych rezultatów
Początkowa konfiguracja
Okres analizy wstecznej: Dostosuj parametr Okresu analizy wstecznej do ram czasowych, na których handlujesz — wyższe wartości dla wyższych ram czasowych.
Liczba świec do analizy: Utrzymuj na poziomie 500 dla solidnej analizy lub zmniejsz, aby uzyskać szybsze reakcje.
Kolor puli płynności: Wybierz kolor, który wyróżnia się na twoim wykresie.
Interpretacja sygnałów
Sygnały bloków zleceń:
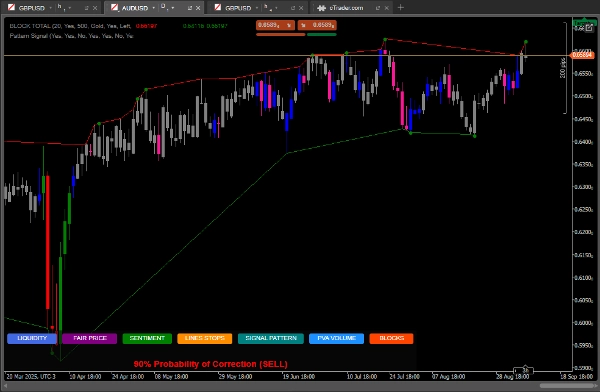
Zielone kropki: sygnały kupna, gdy cena zamyka się powyżej niepokonanego minimum.
Czerwone kropki: sygnały sprzedaży, gdy cena zamyka się poniżej niepokonanego maksimum.
Pule płynności:
Linie poziome pokazują obszary płynności, potencjalne cele lub punkty odwrócenia.
Monitoruj relację między płynnością powyżej/poniżej bieżącej ceny.
Sentyment rynku:
Użyj przycisku SENTIMENT, aby zobaczyć dominujący kierunek i poziom pewności.
Sentyment kupna z wysoką pewnością sugeruje kontynuację wzrostu. Sentyment sprzedaży z wysoką pewnością sugeruje kontynuację trendu spadkowego.
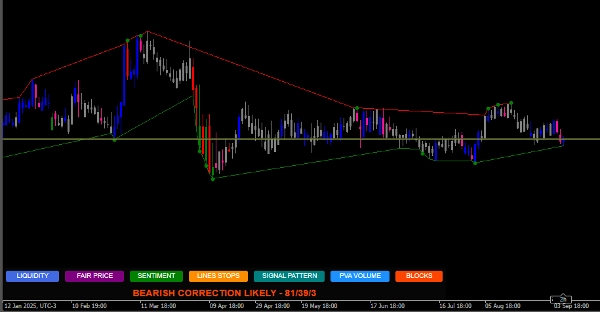
Formacje świecowe:
Przycisk SIGNAL PATTERN analizuje i
Pokazuje prawdopodobieństwa korekty na podstawie stosunku ilościowego
Najczęściej handlowana uczciwa cena:
Przycisk PRICE pokazuje poziom cenowy z najwyższym wolumenem dnia.
Może działać jak magnes dla cen lub jako wsparcie/opór.
Strategie użytkowania
Strategia konserwatywna:
Handluj tylko wtedy, gdy sygnały bloków zleceń pokrywają się z dominującym sentymentem.
Używaj puli płynności jako celów realizacji zysków.
Strategia agresywna:
Przewiduj odwrócenia, gdy cena zbliża się do puli płynności z wieloma zgromadzonymi zleceniami stop.
Wykorzystuj dywergencje między sentymentem a akcją cenową do transakcji przeciwtrendowych.
Dodatkowe potwierdzenie:
Porównaj z formacją świecową pokazaną przez wskaźnik.
Sprawdź, czy uczciwa cena jest w pobliżu jako obszar zainteresowania.
Zarządzanie ryzykiem.
Stop-Loss:
Umieść poniżej najnowszego bloku zleceń przy zakupach
Umieść powyżej najnowszego bloku zleceń przy sprzedaży
Take-Profit:
Cele w pobliskich pulach płynności
Uwzględnij stosunek płynności powyżej/poniżej, aby ustawić cele
Zaawansowane wskazówki
Użyj przycisku TOGGLE LINES, aby wyłączyć linie płynności, gdy wykres staje się zagracony
Monitoruj liczbę zlikwidowanych zleceń stop, aby ocenić siłę ruchu
Uczciwa cena jest szczególnie przydatna na rynkach ograniczonych zakresem jako dynamiczne wsparcie/opór
Łącz z innymi wskaźnikami dla potwierdzenia wolumen, średnie kroczące
WZÓR SYGNAŁU DOSTĘPNY W RAMACH CZASOWYCH D1.
https://ctrader.com/pt/products/1725?u=Goulart
https://ctrader.com/pt/products/1386?u=Goulart
Podsumowanie
The indicator also analyzes liquidity pools, highlighting areas where stop losses may accumulate and monitoring the activation of buy and sell stops. It calculates market sentiment based on liquidity distribution and identifies the most traded price level of the day, which can act as dynamic support or resistance.
Users can customize parameters such as lookback period and number of candles for analysis to suit different timeframes and trading styles. Visual signals include green and red dots for buy and sell order block signals, horizontal lines for liquidity pools, and sentiment indicators showing prevailing market direction and confidence.
The tool supports conservative strategies that align order block signals with sentiment and use liquidity pools as profit targets, as well as aggressive strategies that anticipate reversals near liquidity pools and exploit divergences between sentiment and price action. Additional features include candlestick pattern correction probabilities and options to toggle liquidity lines for chart clarity. Risk management guidance suggests placing stop-loss orders relative to recent order blocks and setting take-profit targets near liquidity pools.


