Trading product for wt.Delta Widget Indicador Premium/Discount  Liquidity Sweep, image 1
Indicador
Versão 1.0, Jul 2026
Windows, Mac
Trading product for wt.Delta Widget Indicador Premium/Discount  Liquidity Sweep, image 2
88.59M
Volume negociado
105.61K
Pips ganhos
72
Vendas
445
Instalações gratuitas


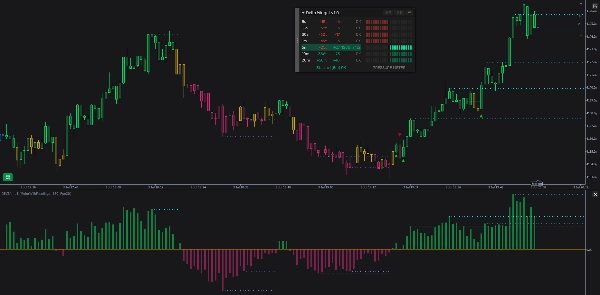
The indicator watches the live tick stream and, for each timeframe you switch on (from 5 seconds up to 20 minutes), keeps a rolling window of recent activity. In each window it compares two things: which way price moved, and which way the order flow leaned (a buy/sell pressure estimate rebuilt from tick movement, since cTrader does not publish real volume). When price and flow point the same way the timeframe reads OK. When they disagree it flags a divergenceBULL when price is falling but flow is buying, BEAR when price is rising but flow is selling — and times how long that disagreement lasts. All of this is surfaced through a draggable on-chart panel (a per-timeframe readout plus a combined verdict line and an optional buy/sell pressure meter), optional bar coloring that tints candles by the prevailing direction, a histogram in the sub-pane, markers when the prevailing direction changes, optional reference levels that make price-vs-histogram divergences easy to see, and optional sound alerts that give you audio cues without watching the screen.


The flow estimate (foundation)

cTrader does not expose real buy/sell volume, so the indicator estimates flow from price movement itself: each up-move counts as buying, each down-move as selling, and a tick with no price change either keeps the previous lean or counts as neutral (your choice — see Flat Tick Carry). To avoid being fooled by the bid/ask spread flickering, price is read as the mid-price (the midpoint between bid and ask).

Every tick is processed once and stored in a shared pool that all timeframes read from, so nothing is duplicated and memory stays small even with every timeframe enabled. Each timeframe simply looks at the slice of that pool inside its own window.

For each window the indicator tracks:

  • Price move — how far price travelled over the window, reported in ticks (the instrument's smallest price increment).
  • Flow (delta) — the net buy-minus-sell lean over the same window.


The timeframes

There is one row per timeframe you enable, always ordered shortest to longest: 5s, 15s, 30s, 1m, 5m, 10m, 20m. That order is also the panel's row order, and it sets how much weight each timeframe carries in the bar coloring — slower timeframes count for more.

When the indicator loads, it warms up each timeframe by replaying recent history through exactly the same path live ticks take, so every row is meaningful immediately instead of starting blank and filling in over real time (see Preload History and Max History Bars).


The panel

A draggable panel sits on your chart. It has a title bar with three buttons, a body that can show a readings table, a pressure meter, or both, and a combined verdict line.


Readings table

One row per timeframe, with four columns:

  • TF — the timeframe label (5s, 15s, …20m).
  • Price — the price move over the window in ticks, with a sign (for example +350t or -650t). Green when up, red when down.
  • Delta — the flow lean as a signed number (for example +16 or -12). Green when buying leads, red when selling leads. Large values are shortened with a k (for example +1,2k).
  • StatusOK when price and flow agree, or an arrow plus a duration when the timeframe is diverging: ↗ 2m 15s for a BULL divergence, ↘ 45s for a BEAR one. The whole row is tinted faint green (BULL) or faint red (BEAR) while a divergence is active.


Pressure meter

An alternative (or additional) view that turns each timeframe row into a left/right bar chart of buy/sell pressure. From a thin centre line, selling pressure lights cells to the left and buying pressure lights cells to the right. How many cells light up reflects how loaded that timeframe is relative to its own recent normal, so a fast timeframe and a slow one are each shown against their own baseline rather than against each other. The lit cells brighten when that timeframe is in a real BULL or BEAR divergence. A "PRESSURE METER" title and its own verdict line sit beneath it.

In the both layout, the meter and the readings table appear side by side and share a single verdict line.


Bar coloring (the regime)

Optionally, the indicator paints your price candles by the prevailing direction — the regime — which is a steadier read than any single timeframe. It can be Bull, Bear, or Conflict, and it is held with built-in stickiness so it stays put across bars and only changes when the lean clearly shifts (this avoids constant flip-flopping).

What the regime is built from. Every enabled timeframe "votes" each bar based on its price direction, and the votes are combined into one running number. Slower timeframes and bigger moves count for more. That combined number is then smoothed over recent bars. The smoothed result is the single thing that drives both the bar color and the histogram in §6, so the two can never disagree.


The histograms

The same smoothed vote that colors the bars is also drawn as a histogram in the indicator's own pane below price: green bars above the centre when the net lean is bullish, red bars below when bearish, one bar per closed candle (the current bar updates live). Taller bars mean a stronger lean. Because it is the very same number behind the bar coloring, the histogram and the candle colors always agree. It is useful on its own for spotting momentum fading — for example price pushing to a new high while the histogram's peaks are getting shorter.


Reference levels

Optionally, the indicator draws flat horizontal reference lines that highlight the histogram's peaks and troughs on both panes at once: the line in the sub-pane sits at the histogram's extreme, and a matching line on the price chart sits at that same bar's high (for an up-extreme) or low (for a down-extreme). Putting the same reference on both panes makes a divergence jump out — for instance price printing a new high while the histogram's matching line shows it failed to.


Sound alerts

The indicator can give you audio cues so you do not have to watch the panel. There are two independent alert sources, and both only work while the panel is showing the pressure meter (either the meter-only or the side-by-side layout) — the alerts are built around the meter reading. Each source also has its own on/off button, and a shared cooldown stops a jumpy market from spamming sounds.


Loading & consistency

With Preload History on, the indicator rebuilds recent history at load — the bar coloring, histogram, markers, and reference levels all appear immediately rather than only forming going forward. Max History Bars sets how far back that reconstruction runs (further back gives more context but loads more slowly).

The reconstructed history is built to match what a live session would have produced.


How the pieces fit together

  • The flow estimate and the timeframes are the foundation — everything else reads from them.
  • The readings table, pressure meter, and verdict line show each timeframe's state and the single combined verdict.
  • Bar coloring and the histogram share one smoothed direction read, so they always agree.
  • Markers fire when that direction changes, at candle close.
  • Reference levels mark the histogram's peaks and troughs on both panes.
  • Sound alerts voice the pressure meter and the combined verdict, so you can step away from the screen.
Perfil do indicador
Categoria do indicador
Fluxo de ordens/DOM
Tipo de resultado
Visualização
Sinais
Filtro
Requisitos de dados
Dados de tick
Sinais suportados
Divergência
Quebra
Inversão
Força da tendência
Volatilidade
Toque no nível
Quebra de nível
Cruzamento
0.0
Avaliações: 0
Avaliações de clientes
Ainda não há avaliações para este produto. Já o experimentou? Seja o primeiro a contar a outras pessoas!
Premium/Discount
Liquidity Sweep
Imbalance
Order Block
Market Structure
Liquidity Grab
Support & Resistance
Os produtos disponíveis através da cTrader Store, incluindo bots de negociação, indicadores e plugins, são fornecidos por programadores terceiros e são disponibilizados apenas para fins informativos e de acesso técnico. A cTrader Store não é um corretor e não fornece aconselhamento em matéria de investimento, recomendações pessoais ou qualquer garantia de desempenho no futuro.

Mais deste autor

Indicador
Prop
Forex
+12
Lightweight Risk-Reward Visualization Tool.
Plugin para desktop
Forex
Crypto
+3
Build custom second and tick charts using adjustable bar sampling intervals.
Plugin para desktop
Stocks
Indices
+1
Build custom charts based on specific trading sessions.
cBot
Fixed Risk %
No Overtrading
+5
Turn Your Keyboard into a Trading Console — Instant Entries, Exits, and Precision Risk Control.
Indicador
Forex
Crypto
+5
Experience a new approach with amplitude-based momentum analysis. Smart Trend Detection That Adapts to Market Volatility
Plugin para desktop
Forex
Signal
+2
Adaptive Renko chart builder for precise, flexible trading - ideal for both scalping and trend analysis.
Indicador
Key Levels
Supertrend
+1
A cTrader indicator for clear trend direction, entry timing, and on-chart risk visualization.
Indicador
Imbalance
Key Levels
+2
A Next-Generation Adaptive Oscillator with Z-Score Regime Engine.
Indicador
Forex
Crypto
+5
This indicator combines two independent analytical engines into a single overlay on your chart.
Plugin para desktop
Chart UI Tools
Trend Reversal (TRev) charts plot candlesticks according to the distance price moves, not the passage of time.
Indicador
Forex
Crypto
+5
Combines multiple Currency Pairs / Symbols into a single Weighted Average Strength of that currency.
Indicador
Prop
Forex
+5
A channel-based trend indicator that combines three distinct analytical layers into a single, readable overlay.

Também poderá gostar de

Indicador
Forex
BTCUSD
+12
Pro Structure Patterns Detector
Indicador
AI
ATR
+18
Scalping signals with EMA/RSI/ATR logic. Visual cloud shows precise entry and exit zones. Built for M1/M5 scalpers.
Indicador
VWAP
Fibonacci
+5
Market Blueprint - SMC/ICT One Indicator. Eleven Core Module, Single Chart , MTF candles, MTF FVG
Indicador
ATR
SMC
+20
Session boxes, liquidity sweeps and higher‑timeframe levels for intraday trading
Indicador
SMC
BTCUSD
+5
SMC ICT Control Panel The all-in-one Smart Money command center for cTrader. One indicator. Every SMC/ICT tool. Zero clu
Indicador
RSI
Signal
The Wyckoff Toolkit is the ultimate ally for traders seeking to decode the market through the lens of "smart money."
Indicador
Prop
Forex
+3
Price Change Bundle 3-in-1 Levels • Bars • Histogram. Secret of Price Change
Indicador
Forex
Crypto
+3
This is a tool to help traders open orders/close orders/modify orders quickly with just one click
Indicador
ATR
RSI
+2
This indicator works best as a trend-confirmation tool—wait for multiple signals!
Indicador
ATR
RSI
+5
One of the best indicators we have ever developed, with a very high profit ratio.
Logótipo de "BvsB 2026"
Bem avaliado
4.7
(4)
$100
Indicador
Prop
Forex
+1
Smart support/resistance indicator with rejection-only Buy/Sell signals designed for H1 charts.
Indicador
SMC
Pro Volume Profile with Delta, Session Filters & CSV Export. Precision order flow analysis.
Indicador
AI
RSI
+19
The HAI Quantum V10 is an advanced indicator designed for technical analysis.
Indicador
Forex
Crypto
+4
Statistical boundaries that adapt to real-time volatility for a better risk management.
Indicador
AI
ATR
+26
The Triple Momentum indicator for cTrader is a versatile trend-following tool.
Indicador
Imbalance
Key Levels
+2
A Next-Generation Adaptive Oscillator with Z-Score Regime Engine.
Indicador
Forex
Signal
Literally the best Linear Regression Indicator out there. 8 distinct mathematical models and more!
Indicador
Volume
Imbalance
+5
Professional OrderFlow Footprint Analysis ( Bid/ask, POC, VA, Delta, Absorption, Imbalance )
88.59M
Volume negociado
105.61K
Pips ganhos
72
Vendas
445
Instalações gratuitas