
説明
振幅モメンタムラベル — ボラティリティに基づく適応型トレンド検出
振幅モメンタムラベラーは複数の高度な概念を統合しています:
- レジーム検出 — 真のトレンドフェーズを特定します
- ボラティリティ適応 — 現在の市場状況に自己調整します
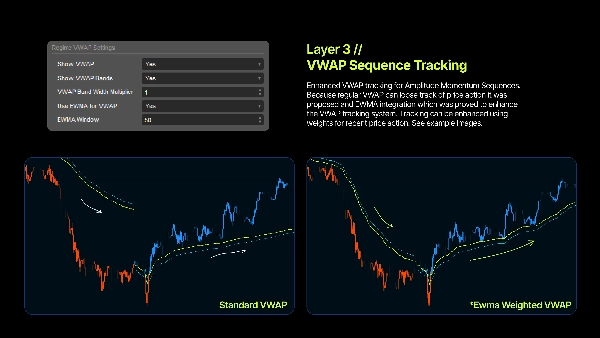
- 動的VWAP — 意味のある押し目および継続レベルを強調表示します
- ロールスプレッド推定器 — トレンド中の最適な再エントリーポイントを示します
- 最適化モジュール — 自己最適化機能付き**
これにより、継続的な手動調整なしで明確さ、適応性、実用的な取引ゾーンを提供するインテリジェントで自己調整型のインジケーターが作成されます。
それは何ですか?
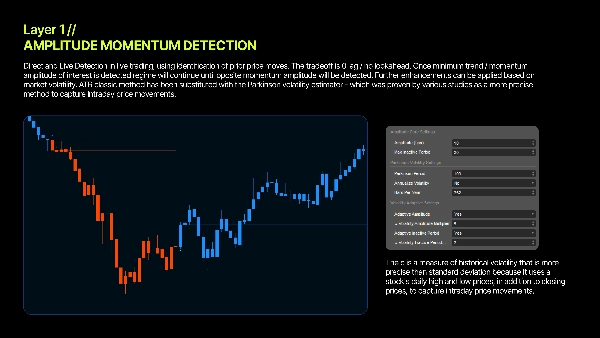
振幅モメンタムラベラーは、レジーム検出インジケーターであり、市場が上昇または下降のモメンタムフェーズに入るまたは退出するタイミングをリアルタイムで特定します。
従来の移動平均クロスオーバーとは異なり、価格の変位と反転の強さを評価することで実際のモメンタム変化を測定します。
核心の質問
現在市場はモメンタムフェーズにあるのか、そしてその方向は?
これに答えるために、インジケーターは以下を追跡します:
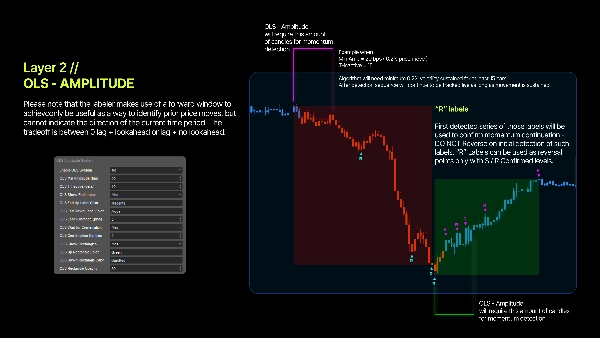
- 振幅 — 価格がどれだけ動いたか;
- シーケンス — 高値と安値が発生する順序。
強い動きの後に意味のある反転が続くと、新しいモメンタムレジームの始まりを示します。
動作原理
1. スイングを測定する
インジケーターは常に最高値と最安値の極値を更新します。
その差分—振幅—が市場の現在のスイングサイズを定義します。
2. 反転を検出する
- 急激な下落の後に強い上昇 → **上昇モメンタム**
- 急激な上昇の後に強い下落 → **下降モメンタム**
3. 重要性を確認する
ボラティリティ調整された閾値を超える反転のみが有効なシグナルを発します。
4. 疲労を検出する
価格の進行が止まると、インジケーターはモメンタムの疲労を識別し中立に戻ります。
パーキンソンボラティリティ — 適応型閾値
ほとんどのインジケーターは固定パラメーターを使用しますが、これは自動的に適応します。日中の高値/安値レンジを取り入れたパーキンソンボラティリティを使用することで、市場の実際の状況に基づいて感度を調整します。その結果、静かな環境でも変動の激しい環境でも一貫したパフォーマンスを実現します。(統計的にATRメソッドより効率的であることが証明されています)
レジームVWAP — 再エントリーのための動的レベル
レジームがアクティブになると、インジケーターはそのトレンドに特化したVWAPを計算し、動的サポートおよび動的レジスタンスレベルを提供します。機関投資家はVWAPに大きく依存しており、価格はしばしばその周辺で反応するため、押し目買いのエントリーに最適です。
EWMAモード
EWMAを有効にすると、最近の価格により重みを置き、より滑らかで反応の良いVWAP曲線を作成します。長期トレンド中の再エントリーの識別に優れています。
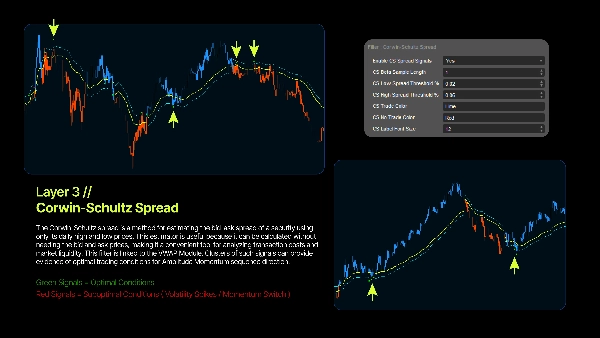
ロールスプレッド推定器 - 再エントリーのための動的フィルター
ロールスプレッド推定器は、観測された取引価格からビッド・アスクスプレッドを推定する方法で、通常は価格変動の系列共分散を使用します。ロールによって開発され、連続する取引がビッド価格とアスク価格の間で交互に行われ、新しい情報が「真の」価格を絶えず動かしていないと仮定します。シンプルで基礎的な方法ですが、元の方法は下方バイアスや特定のデータセットでの性能低下などの問題に対応するために改良されています。この推定器は、新しい情報がリリースされない場合、価格は単にビッドとアスクの間で跳ね返るという考えに基づいています。買い主導の取引と売り主導の取引が同等の確率であると仮定しています。
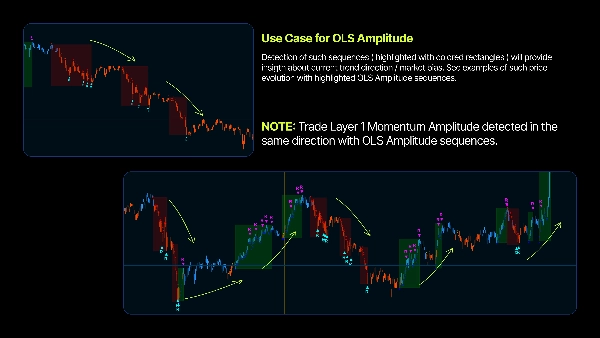
使用の利点
1. 客観的なトレンド識別 - トレンドライン不要。推測不要。数学がレジームを定義します。
2. ボラティリティ適応型 - パーキンソンボラティリティを使用して変化する状況に自動調整します。
3. 明確なエントリーゾーン - レジームVWAPレベルが直感的な押し目および追加エリアを特定するのに役立ちます。
4. 定義されたレジーム境界 - モメンタムの開始と終了を正確に把握できます。
5. マルチタイムフレーム互換性 - ベーシスポイント正規化により、どのチャートでも一貫した動作を保証します。
定量的基盤
対数リターン
対数リターンを使用することで対称性が確保され、モメンタム測定が数学的に堅牢になります。
ベーシスポイント
すべての計算は標準化されたbps単位(1bps = 0.01%)を使用し、資産間の一貫性を可能にします。
リトレースメント検出
モメンタムの変化は、強い方向性の動きの後に意味のある逆方向の動き(V字型反転)によって識別されます。
合成ボリューム
レンジとボディに基づく合成ボリュームにより、どのシンボルでもVWAPの精度が保証されます。
⎽⎽⎽⎽⎽⎽⎽⎽⎽⎽⎽⎽⎽⎽⎽⎽⎽⎽⎽⎽⎽⎽⎽⎽⎽⎽⎽⎽⎽⎽⎽⎽⎽⎽⎽⎽⎽⎽⎽⎽⎽⎽⎽⎽⎽⎽⎽⎽⎽⎽⎽⎽⎽⎽⎽⎽⎽⎽⎽⎽⎽⎽⎽⎽⎽⎽⎽⎽⎽⎽⎽⎽⎽⎽⎽⎽⎽⎽⎽⎽⎽⎽⎽⎽⎽⎽⎽⎽⎽⎽⎽⎽⎽⎽⎽⎽⎽⎽⎽⎽⎽⎽⎽⎽⎽⎽⎽⎽⎽⎽⎽⎽⎽⎽
このツールは教育および情報提供のみを目的としています。投資アドバイスではありません。取引にはリスクが伴い、損失が預金を超えることがあります。過去のパフォーマンスは将来の結果を保証するものではありません。すべての取引決定は自己責任で行ってください。作成者はインジケーターの使用によるいかなる財務損失についても責任を負いません。取引前に必ずご自身で分析を行ってください。
概要
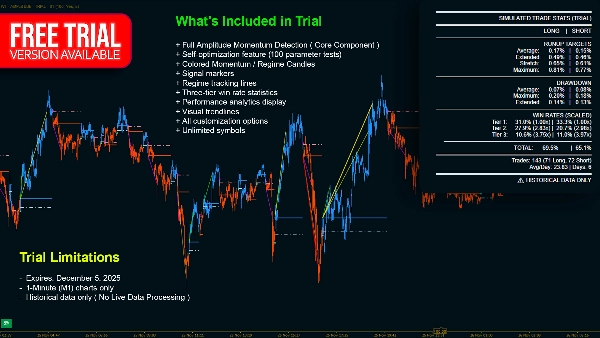
Key features include:
- **Regime Detection:** Pinpoints market entry and exit points for momentum trends.
- **Volatility Adaptation:** Uses Parkinson Volatility to self-tune sensitivity based on current market conditions, ensuring consistent performance across varying volatility.
- **Dynamic VWAP:** Calculates a volume-weighted average price specific to each trend regime, providing dynamic support and resistance levels for pullback and continuation entries.
- **Roll Spread Estimator:** Estimates bid-ask spreads to signal optimal re-entry points during trends.
- **Self-Optimization Module:** Automatically adjusts parameters without manual intervention.
The indicator operates by continuously tracking price extremes to measure swing amplitude, detecting significant reversals that exceed volatility-adjusted thresholds, and identifying momentum exhaustion when price progression stalls. It uses logarithmic returns and basis-point normalization for mathematically robust, cross-asset consistency. Synthetic volume calculations enhance VWAP accuracy across symbols.
This tool supports multiple markets including Forex, stocks, indices, commodities, and cryptocurrencies, and is compatible with various timeframes. It outputs visual signals and filters to assist traders in objective trend identification and clear entry zone determination.
カスタマーレビュー
5 | 75 % | |
4 | 25 % | |
3 | 0 % | |
2 | 0 % | |
1 | 0 % |


