
WT - Tick Imbalance Bars
インジケーター
2 購入済
バージョン 2.0、Nov 2025
Windows、Mac
5.0
レビュー: 1
説明
TIB — ティックアンバランスバーインジケーター。価格が動く前に市場情報を検出
バージョン 2.0
詳細についてはコメント欄をご利用ください
購入後にセットアップガイド付きのビデオセッションが利用可能
Tick Imbalance Barsは、cTraderに機関投資家レベルの市場マイクロストラクチャ分析をもたらします。Marcos López de Pradoの画期的な研究に基づき、彼の著書Advances in Financial Machine Learningで詳述されているように、このインジケーターは時間や出来高ではなく、情報の到着によって価格データをサンプリングします。
核心的な洞察
従来のバー(時間、ティック、出来高)は市場を均一にサンプリングし、情報を持つトレーダーが行動する重要な瞬間を見逃します。Tick Imbalance Barsは、買いまたは売りの圧力が予想レベルを超えたときに検出することでこれを解決し、情報を持つトレーダーの存在と市場が均衡に達する前の潜在的な価格変動を示します。
仕組み
このインジケーターはティックルールを適用し、各取引を買い圧力(+1)または売り圧力(-1)として分類します。次に、これらの符号付きティックを累積し、累積アンバランス(θT)が指数加重移動平均(EWMA)を用いて計算された動的閾値を超えるまで蓄積します。この期待される閾値は、買いと売りのティックの過去の確率を分析することで市場状況に適応します。閾値が破られると新しいTIBバーが作成され、各バーは出来高や経過時間に関係なくほぼ同等の市場情報量を含みます。
主な特徴
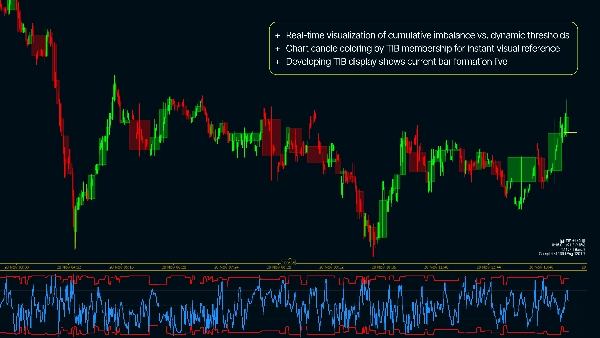
- 累積アンバランスと動的閾値のリアルタイム可視化
- 即時視覚参照のためのTIBメンバーシップによるチャートキャンドルの色分け
- 現在のバー形成をライブで表示する開発中のTIB表示
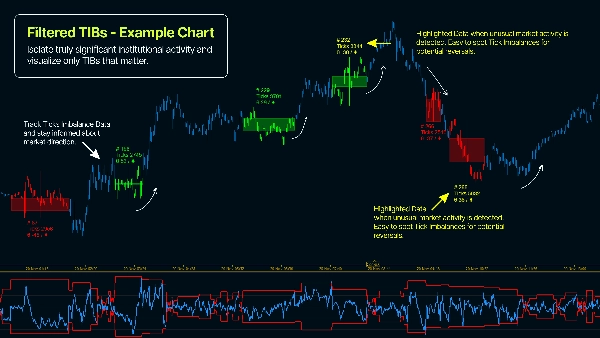
- 統計的に有意なバーのみを表示する最小ティックフィルター
- 完全に設定可能な期待バーサイズとEWMAパラメーター
- アンバランス強度と情報密度を追跡するダッシュボードメトリクス
なぜTick Imbalance Barsを使うのか?
- 情報量が多い期間により頻繁にサンプリングし、実用的なボラティリティを捉える
- 価格均衡に達する前に情報を持つ取引活動を検出
- 情報を持たない市場参加者や小口注文のノイズを削減
- 時間ベースのサンプリングよりも優れた統計的特性(IIDガウス様リターン)を実現
- 機関投資家が使用する実証済みの定量的金融手法を適用
- 価格方向の予測因子として実証された注文フローの非対称情報を識別
基本設定の実用的セットアップガイド( ! )
- 1分足タイムフレーム(またはそれ以下 - ティックベースのチャートを使用)にインジケーターを適用
- E[T] - サンプリング用のバーあたり期待ティック数を入力(初期値は1000)
- EWMAアルファ - [0.001 - 0.5]、0.001は理論上最も安定した結果をもたらし、0.5はより最近のデータに基づくTIBを生成
- 初期アンバランス - 推奨は0.5ですが、実験可能(0.5 = 初期化時の中立アンバランス)
概要
AIによる概要
WT - Tick Imbalance Bars is an indicator for cTrader that applies institutional-grade market microstructure analysis based on the research of Marcos López de Prado. Unlike traditional bars that sample price data by time or volume, this indicator samples based on information arrival, detecting buying or selling pressure imbalances that signal informed trading activity before price equilibrium is reached.
The indicator classifies each trade as buying (+1) or selling (-1) pressure using the tick rule and accumulates these signed ticks until a dynamic threshold—calculated via an Exponentially Weighted Moving Average (EWMA)—is exceeded. When this threshold is breached, a new Tick Imbalance Bar (TIB) is formed, each containing roughly equal market information regardless of elapsed time or volume.
Key features include real-time visualization of cumulative imbalance versus dynamic thresholds, candle coloring by TIB membership, live display of the developing bar, a minimum ticks filter for statistical significance, configurable expected bar size and EWMA parameters, and dashboard metrics tracking imbalance intensity and information density.
This approach enables more frequent sampling during high-information periods, reduces noise from uninformed trades, and provides better statistical properties than time-based sampling. It supports markets including Forex, indices, and cryptocurrencies, and is suitable for strategies such as scalping and breakout trading.
インジケーターのプロフィール
カスタマーレビュー
5.0
レビュー: 1
5 | 100 % | |
4 | 0 % | |
3 | 0 % | |
2 | 0 % | |
1 | 0 % |
カスタマーレビュー
November 30, 2025
WT - Tick Imbalance Bars paints a clean picture of supply/demand imbalances on tick-by-tick data. Great for scalpers and order-flow traders who want to see where traders are stepping in hard. Bars highlight strong imbalances instantly. On higher timeframes it loses noise advantage - best as a micro-timeframe tool. Alerts and stats would make it even stronger.
ディスカッション
よくあるご質問
Prop
Forex
Signal
Breakout
Scalping
Indices
Crypto
cTrader Storeで入手可能な取引ボット、インジケーター、プラグインなどの商品は、第三者の開発者が提供するものであり、情報と技術の取得のみを目的としてご利用いただけます。cTrader Storeはブローカーではなく、投資助言や個人的な推奨を行うことも、将来のパフォーマンスを保証することもありません。
この作成者の他の商品


価格
88.59M
取引数量
105.61K
獲得pips
75
販売
457
無料インストール