説明
通貨バスケット - カスタム複合インデックスインジケーター
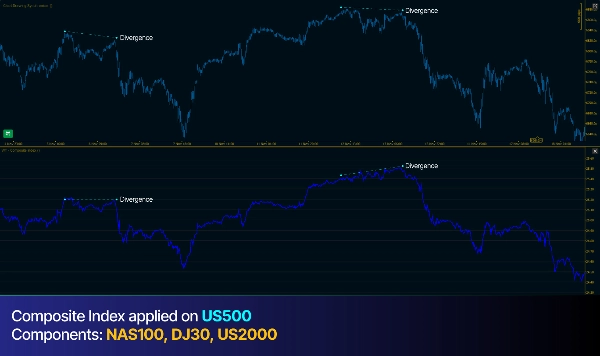
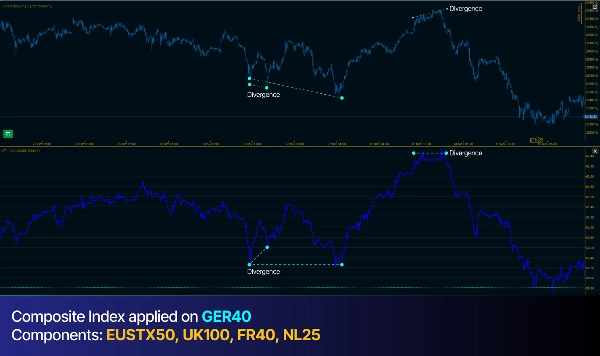
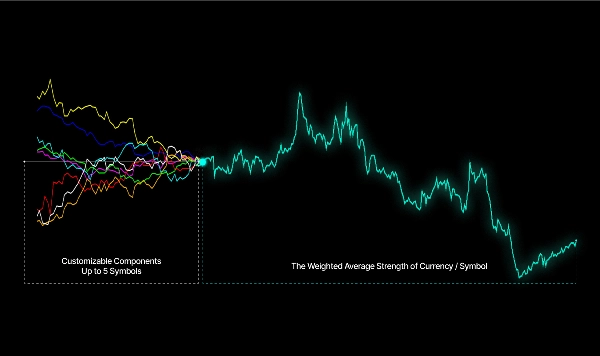
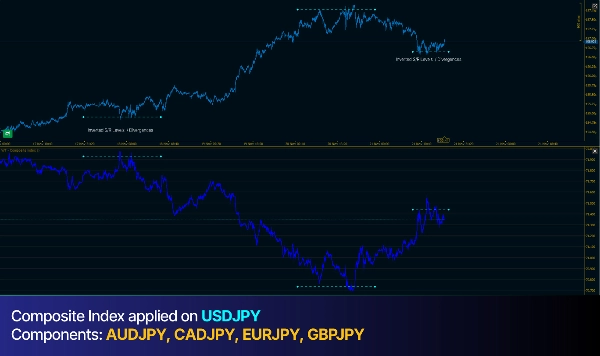
このインジケーターは複数の通貨ペアを単一の複合強度インデックスにまとめ、チャートの下の別パネルに表示します。価格チャートとバスケットインデックスの両方でピボットポイント(フラクタル)を自動検出し、それらをトレンドラインで結んでダイバージェンスを明らかにします。
バージョン 2.0 - リリースノートタブを参照
今後のアップデートに対応
-------------------------------------------------------------------------------------------------------------------------------------------------------
機能概要
-------------------------------------------------------------------------------------------------------------------------------------------------------
- 複合バスケット: 選択した5つの通貨ペアを均等に加重し、強度インデックスを作成
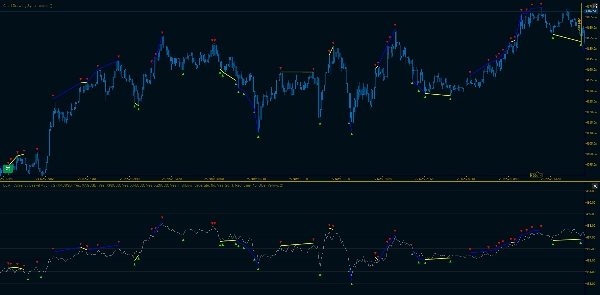
- 自動フラクタル検出: 設定可能な左右バー数に基づき、チャート上のピボット高値と安値を識別
- 連続追跡: 同種の連続ピボットポイント(高値または安値)を追跡し、トレンドラインで接続
- ダイバージェンスの強調表示: 価格とバスケットが逆方向に動く(ダイバージェンス)場合はトレンドラインを黄色に、自動的に同方向の場合は白色に着色
-------------------------------------------------------------------------------------------------------------------------------------------------------
加重平均の複数計算モード
-------------------------------------------------------------------------------------------------------------------------------------------------------
- 終値: 終値を用いた単一の滑らかなライン
- 加重(HL2): 高値と安値の平均を用いた単一ライン
- 高値/安値別: 2本のライン—高値フラクタルはバスケットの高値と比較し、安値フラクタルはバスケットの安値と比較
-------------------------------------------------------------------------------------------------------------------------------------------------------
カスタマイズ可能な設定
-------------------------------------------------------------------------------------------------------------------------------------------------------
- 個別の通貨ペアの有効/無効切り替え
- 調整可能なピボット検出感度
- フラクタル、トレンドライン、ダイバージェンスの色設定可能
- クオート通貨の強度分析のための反転オプション
- 最適な視覚表示のためのスケール乗数
このインジケーターは任意の時間枠で動作し、検出されたすべてのフラクタルとトレンドラインを価格チャートとバスケットパネル間で自動的にミラーリングして、視覚的な比較を容易にします。
概要
カスタマーレビュー
5 | 100 % | |
4 | 0 % | |
3 | 0 % | |
2 | 0 % | |
1 | 0 % |