
Описание
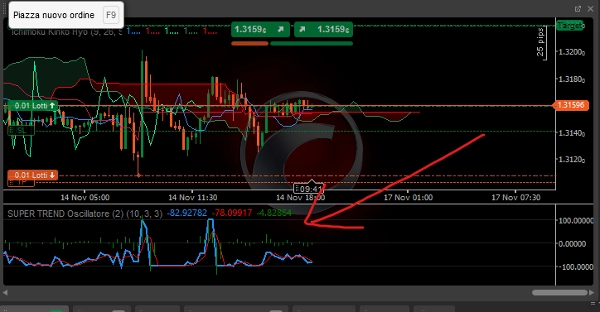
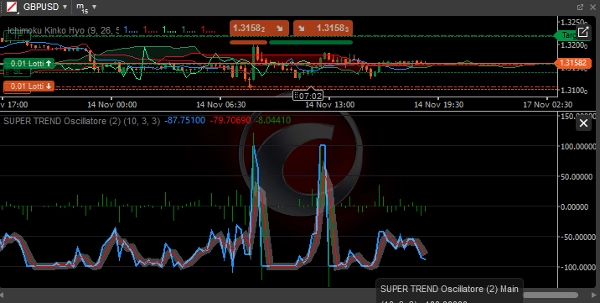
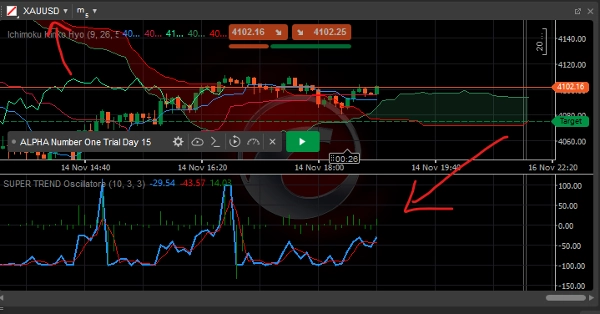
SUPER TREND Осциллятор
Упрощённый осциллятор SuperTrend - Полное описание
Обзор
Упрощённый осциллятор SuperTrend - это продвинутый технический индикатор для cTrader, который преобразует классический SuperTrend в визуальный осциллятор, облегчая определение направления тренда, его силы и надёжности.
Основные компоненты
1. Основная линия (синяя)
- Функция: Показывает нормализованное расстояние между ценой и линией SuperTrend
- Расчёт:
((Price - SuperTrend) / (ATR × Multiplier)) × 100 - Интерпретация:
-
- > 0: Бычий тренд (цена выше SuperTrend)
- < 0: Медвежий тренд (цена ниже SuperTrend)
- Диапазон: От -100 до +100
2. Сигнальная линия (красная)
- Функция: Простое скользящее среднее основной линии
- Период: Настраиваемый (по умолчанию 3 периода)
- Использование: Фильтрует рыночный шум и подтверждает сигналы
3. Гистограмма (серая)
- Функция: Разница между основной и сигнальной линиями
- Интерпретация:
-
- Положительная: Ускорение бычьего импульса
- Отрицательная: Ускорение медвежьего импульса
- Пересечение нуля: Потенциальные развороты импульса
Настраиваемые параметры
Параметры SuperTrend:
- Период ATR: Период для расчёта Average True Range (по умолчанию: 10)
- Множитель: Множитель для полос SuperTrend (по умолчанию: 3.0)
Параметры осциллятора:
- Период сигнала: Период сигнальной линии (по умолчанию: 3)
Интерпретация сигналов
Условия тренда:
- Сильный бычий тренд:
-
- Основная линия > +50
- Основная линия > Сигнала
- Положительная гистограмма
- Сильный медвежий тренд:
-
- Основная линия < -50
- Основная линия < Сигнала
- Отрицательная гистограмма
- Флэтовый рынок:
-
- Основная линия между -30 и +30
- Частые пересечения линий
Торговые сигналы:
Вход в лонг:
- Основная линия пересекает 0 сверху вниз
- Гистограмма становится положительной
- Сигнальная линия подтверждает бычий сигнал
- Основная линия выше +20 для подтверждения импульса
Вход в шорт:
- Основная линия пересекает 0 снизу вверх
- Гистограмма становится отрицательной
- Сигнальная линия подтверждает медвежий сигнал
- Основная линия ниже -20 для подтверждения импульса
Выход/фиксация прибыли:
- Лонг: Основная линия > +80 (перекупленность) или пересечение сигнальной линии сверху вниз
- Шорт: Основная линия < -80 (перепроданность) или пересечение сигнальной линии снизу вверх
Преимущества упрощённой версии
1. Оптимизированная производительность
- Более эффективные расчёты
- Меньшее потребление ресурсов
- Более быстрая реакция на изменения цены
2. Простота использования
- Сокращённый набор основных параметров
- Немедленные визуальные сигналы
- Лёгкая интерпретация даже для начинающих трейдеров
3. Надёжность
- Меньшая подверженность шуму
- Чистые и более чёткие сигналы
- Сниженное количество ложных сигналов по сравнению с классическим SuperTrend
Стратегии использования
Стратегия следования за трендом:
- Вход: Основная линия > 0 для лонга, Основная линия < 0 для шорта
- Фильтр: Гистограмма того же знака, что и основная линия
- Выход: Смена знака или достижение экстремальных уровней
Стратегия импульса:
- Вход: Основная линия > +30 (лонг) или Основная линия < -30 (шорт)
- Подтверждение: Ускорение гистограммы
- Выход: Замедление импульса (уменьшение гистограммы)
Стратегия возврата к среднему:
- Вход: Основная линия > +80 (шорт) или Основная линия < -80 (лонг)
- Подтверждение: Разворот гистограммы
- Выход: Возврат к нейтральной зоне
Оптимальные рыночные условия
Трендовые рынки:
- Высокая эффективность
- Продолжительные сигналы
- Меньше ложных срабатываний
Флэтовые рынки:
- Уменьшайте размер лота
- Увеличивайте таймфрейм
- Используйте как фильтр импульса
Лучшие практики
Рекомендуемые таймфреймы:
- Интрадей: M15 - H1
- Свинг-трейдинг: H4 - D1
- Позиционная торговля: W1 - MN
Управление рисками:
- Стоп-лосс: 1.5-2 × ATR
- Тейк-профит: 2-3 × риск
- Размер позиции: 1-2% от сделки
Дополнительные подтверждения:
- Согласование нескольких таймфреймов
- Подтверждение объёмом
- Ключевые уровни поддержки/сопротивления
Ограничения
Особенности:
- Встроенная задержка (индикатор следования за трендом)
- Сниженная эффективность на флэтовом рынке
- Необходимость подтверждений при низкой волатильности
Рекомендации:
- Комбинируйте с анализом ценового действия
- Используйте как фильтр, а не как самостоятельную систему
- Тестируйте на демо перед использованием в реальной торговле
Этот осциллятор представляет собой мощный инструмент для выявления сильных трендов и фильтрации ложных сигналов, при этом сохраняя простоту использования, подходящую как для начинающих, так и для опытных трейдеров.
Сводка
Отзывы покупателей
5 | 67 % | |
4 | 33 % | |
3 | 0 % | |
2 | 0 % | |
1 | 0 % |


