
Renko Line Chart
Indicador
1 compras
Versão 1.0, Jun 2025
Windows, Mac

Descrição
✅ Usa formatação profissional com hierarquia clara
✨ Por que os Traders Adoram
"Finalmente - um indicador que parece tão sofisticado quanto minha estratégia de negociação"
Resumo
Resumo de IA
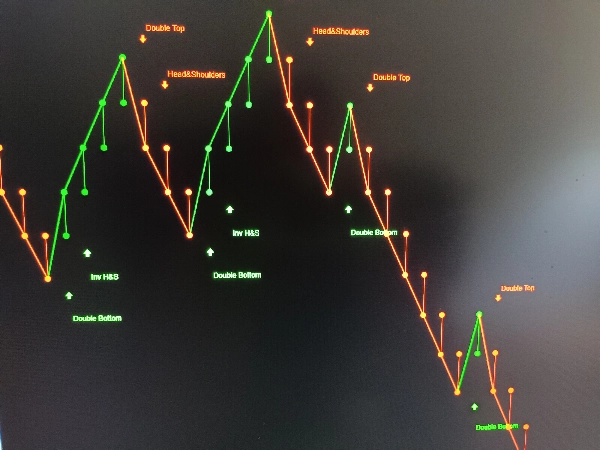
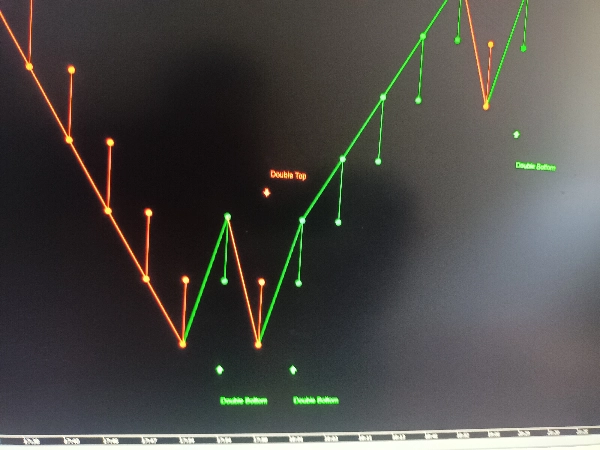
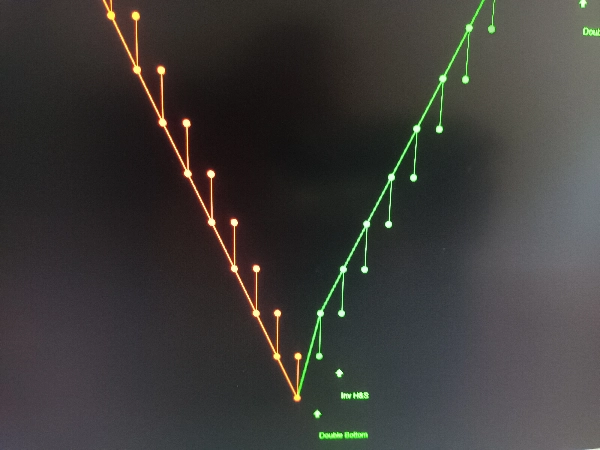
The Renko Line Chart is a trading indicator designed to present price movements with professional formatting and a clear hierarchical structure. It visually represents trend reversals and patterns using Renko charting techniques, which filter out minor price fluctuations to highlight significant market trends. This indicator aims to provide traders with a sophisticated and clear view of market dynamics, supporting decision-making based on trend signals. It is suitable for integration into various trading strategies that benefit from trend analysis and pattern recognition.
Perfil do indicador
Avaliações de clientes
0.0
Avaliações: 0
Avaliações de clientes
Ainda não há avaliações para este produto. Já o experimentou? Seja o primeiro a contar a outras pessoas!
Conversa
Perguntas frequentes
Os produtos disponíveis através da cTrader Store, incluindo bots de negociação, indicadores e plugins, são fornecidos por programadores terceiros e são disponibilizados apenas para fins informativos e de acesso técnico. A cTrader Store não é um corretor e não fornece aconselhamento em matéria de investimento, recomendações pessoais ou qualquer garantia de desempenho no futuro.
Mais deste autor


Preço
Desde 28/01/2025
7
Vendas
339
Instalações gratuitas