
説明
CVD ai
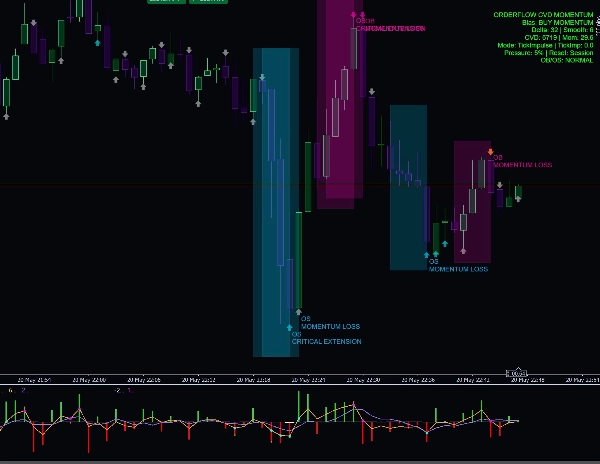
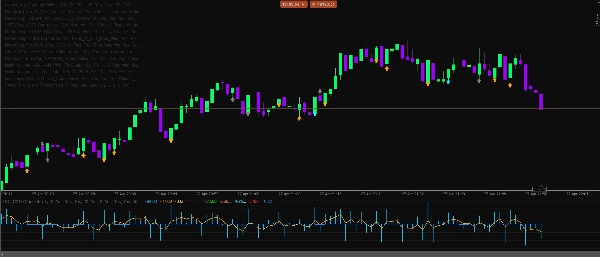
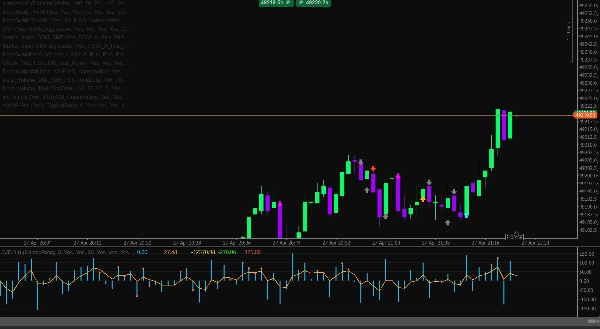
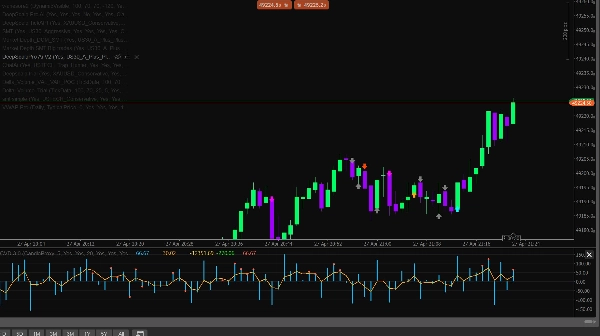
Delta CVD Advancedは、市場の動きから直接買いと売りの圧力をより明確に把握したいトレーダー向けに設計された、プロフェッショナルなモメンタムおよびオーダー分析インジケーターです。Delta、CVD、ライブティックモメンタム、吸収、ダイバージェンス、セッションフィルター、ボラティリティガード、スマートコンフルエンスエンジンを一つのクリーンな分析ツールに組み合わせています。
このインジケーターは、スキャルピング、日中取引、および外国為替、ゴールド、指数、暗号通貨、石油市場における短期モメンタム確認のために構築されています。
主な特徴
- アップティック/ダウンティックロジックを使用したライブDelta計算
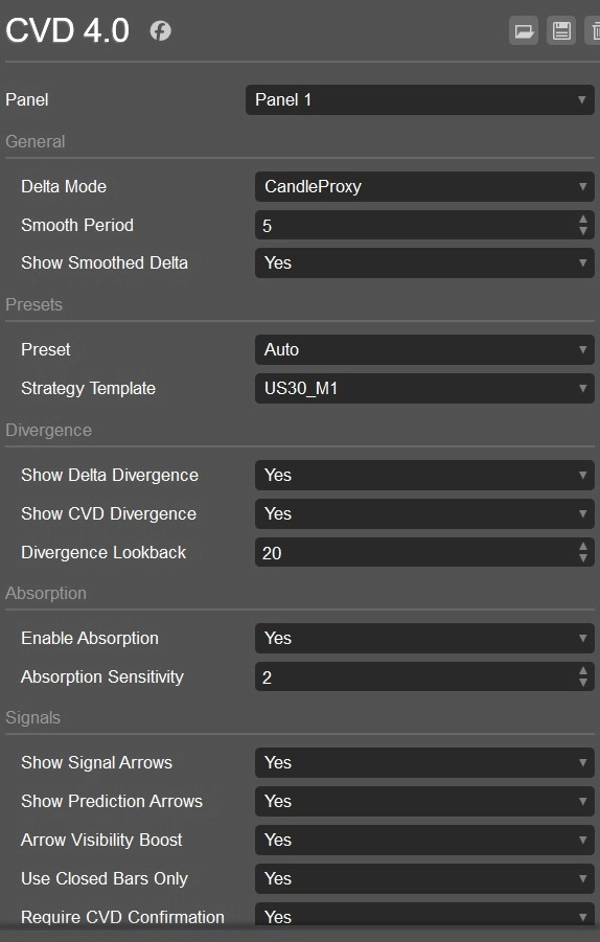
- 履歴分析のためのキャンドルプロキシデルタモード
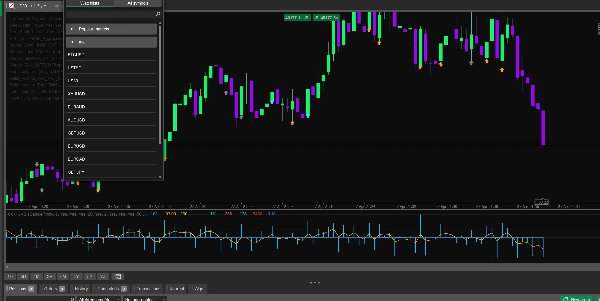
- 時間経過による圧力を追跡する累積ボリュームデルタライン
- よりクリーンなモメンタム読み取りのための平滑化されたDeltaライン
- 買い/売りの色分けされたDeltaヒストグラム
- ライブ市場のインパルスのためのティックベースのモメンタム計算
- CVDスロープとティックインパルスを組み合わせたハイブリッドモメンタムモード
- CVDリセットオプション:なし、日次、またはセッション別
- 強気および弱気のDeltaダイバージェンス検出
- 強気および弱気のCVDダイバージェンス検出
- 価格を動かせない圧力を見つけるための吸収検出
- 買いと売りの機会を示すシグナル矢印
- 早期モメンタムシフト警告のための予測矢印
- シグナルのためのオプションのCVD確認
- 方向性スコアリングを備えたスマートコンフルエンスエンジン
- DOMプロキシ圧力フィルター
- 流動性獲得のためのスイープ検出フィルター
- アジア、ロンドン、ニューヨークのセッションフィルター
- UTC時間を使用した自動セッション検出
- ATR制限を使用したボラティリティガード
- 悪条件の市場を避けるためのスプレッドガード
- 弱い低ボリュームシグナルを避けるためのボリューム比率フィルター
- 外国為替、ゴールド、指数、暗号通貨、石油のシンボルプリセット
- US30 M1、USTECH M1、XAUUSD M1、BTCUSD M1、Oil M1の戦略テンプレート
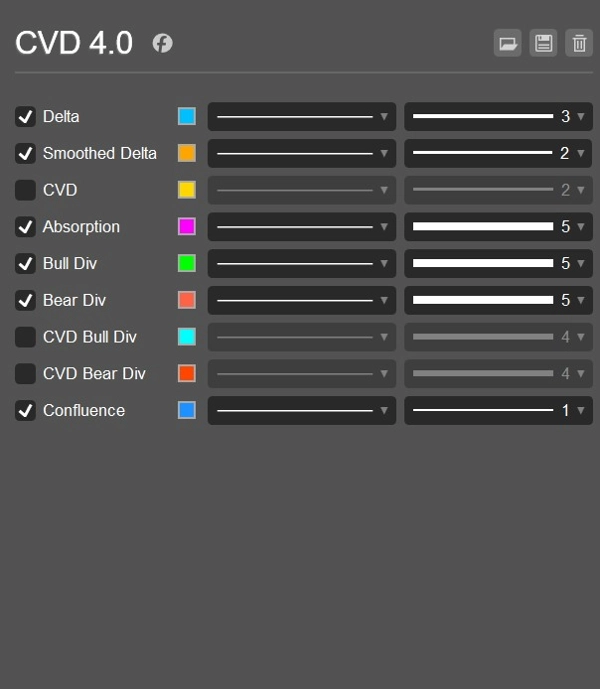
- バイアス、Delta、平滑化Delta、CVD、モメンタム、圧力パーセンテージ、リセットモードを表示する情報ダッシュボード
- クールダウン制御付きのオプションログアラート
トレーダーが使用する理由
Delta CVD Advancedは、現在誰がコントロールしているか(買い手か売り手か)をトレーダーが理解するのに役立ちます。価格のローソク足だけに頼るのではなく、動きの背後にある圧力を分析します。これにより、エントリーの確認、弱いシグナルの回避、反転の特定、吸収の発見、価格に明確に現れる前のモメンタムシフトの検出に役立ちます。
ティックモメンタムモードはリアルタイムの価格インパルスに反応するため、ライブスキャルピングに特に有用であり、CVDと平滑化デルタツールは動きに実際の強さがあるかどうかを確認するのに役立ちます。
最適な使用用途
- スキャルピング
- 日中取引
- モメンタム確認
- 反転確認
- 流動性スイープ分析
- DeltaおよびCVDダイバージェンス取引
- ゴールド、指数、暗号通貨、石油、外国為替ペア
- M1、M5、およびその他の低時間足
重要な注意事項
このインジケーターは分析支援ツールです。利益を保証するものではなく、適切なリスク管理、市場構造、検証済みの取引計画と併用して使用する必要があります。
概要
AIによる概要
CVD Ai is an advanced Volume Spread Analysis (VSA) and Cumulative Volume Delta (CVD) indicator designed to analyze buying and selling pressure in financial markets. It integrates multiple analytical tools including live Delta calculation based on uptick/downtick logic, candle proxy delta for historical data, smoothed Delta lines, and a cumulative volume delta line to track market pressure over time. The indicator features buy/sell colored Delta histograms, tick-based momentum calculations, and a hybrid momentum mode combining CVD slope with tick impulse.
Additional functionalities include detection of bullish and bearish Delta and CVD divergences, absorption detection to identify pressure that fails to move price, and signal arrows for buy/sell opportunities alongside prediction arrows for early momentum shifts. It incorporates session filters for Asia, London, and New York trading sessions, volatility and spread guards, volume ratio filters, and a smart confluence engine with directional scoring.
CVD Ai supports markets such as Forex, Gold, Indices, Crypto, and Oil, and is optimized for scalping, intraday trading, and short-term momentum confirmation on lower timeframes like M1 and M5. It offers strategy templates for specific symbols including US30, USTECH, XAUUSD, BTCUSD, and Oil. The indicator includes an info dashboard displaying bias, Delta, smoothed Delta, CVD, momentum, pressure percentage, and reset mode options.
インジケーターのプロフィール
カスタマーレビュー
4.0
レビュー: 2
5 | 0 % | |
4 | 100 % | |
3 | 0 % | |
2 | 0 % | |
1 | 0 % |
カスタマーレビュー
February 12, 2026
the first 10 trades should stay boring, and The log becomes easier to read.
February 11, 2026
M15 is enough for the first pass. The rules are easier to keep in view.
ディスカッション
よくあるご質問
Signal
Indices
Supertrend
NZDUSD
AI
NAS100
ATR
cTrader Storeで入手可能な取引ボット、インジケーター、プラグインなどの商品は、第三者の開発者が提供するものであり、情報と技術の取得のみを目的としてご利用いただけます。cTrader Storeはブローカーではなく、投資助言や個人的な推奨を行うことも、将来のパフォーマンスを保証することもありません。
この作成者の他の商品


これも好きかも


価格
6
販売
691
無料インストール