Descrição
🚀 INSTITUCIONAL Nonlag Candle - Indicador Profissional de Negociação
Transforme sua negociação com tecnologia de média móvel de nível institucional
INSTITUCIONAL Nonlag Candle é o sistema de média móvel mais avançado projetado para traders sérios que exigem precisão, exatidão e análise de mercado em nível institucional.
💎 Por Que Este Indicador Muda Tudo
Ao contrário das médias móveis tradicionais que ficam atrasadas em relação à ação do preço, este indicador usa algoritmos matemáticos avançados para eliminar o atraso mantendo a precisão. É a mesma tecnologia que traders institucionais usam para se manter à frente dos movimentos do mercado.
✨ Principais Características Que o Diferenciam:
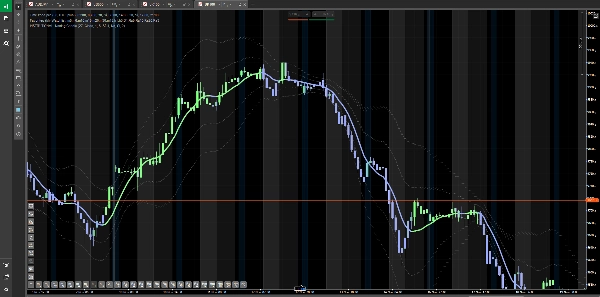
🎯 Tecnologia Zero-Lag
- Responde aos movimentos de preço em tempo real sem o atraso típico das médias móveis padrão
- Detecta mudanças de tendência antes de qualquer EMA, SMA ou WMA
- Perfeito para scalping, day trading e swing trading
📊 Bandas de Desvio Institucionais
- Exibe automaticamente bandas de desvio padrão 1, 2 ou 3
- Identifica condições de sobrecompra/sobrevenda com precisão cirúrgica
- Mostra exatamente quando o preço se moveu rápido demais e longe demais
🎨 Sistema de Clareza Visual
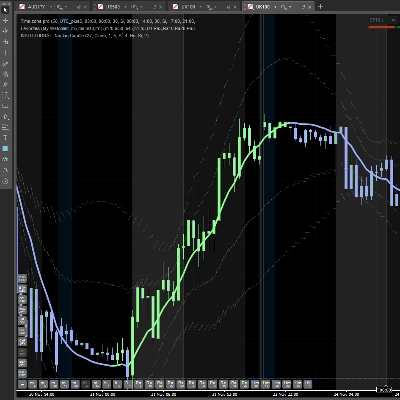
- Velas e linhas codificadas por cores (Verde = Alta, Vermelho = Baixa, Cinza = Neutro)
- Confirmação visual instantânea da direção da tendência
- Sem mais suposições - o mercado mostra o que está fazendo
⚡ Inteligência Ponderada por Volume (Opcional)
- Incorpora dados de volume para leituras ainda mais precisas
- Diferencia entre movimentos fracos e atividade institucional forte
- Dá mais peso à ação de preço com alto volume
🎯 Como Traders Profissionais Usam Este Indicador
Estratégia 1: Entradas de Alta Probabilidade
A Configuração: O mercado está em tendência de alta, mas o preço toca a 2ª ou 3ª banda superior.
Sua Ação: NÃO persiga! O preço está estendido demais. Espere pela retração.
A Entrada: Quando o preço retorna para a linha Nonlag Candle e a cor da vela PERMANECE VERDE (não vira vermelho), esse é seu sinal - a queda é comprável e a tendência está intacta.
Por Que Funciona: Você está comprando com desconto durante uma tendência de alta confirmada. Entrada melhor = stop loss mais apertado = melhor relação risco/retorno.
Estratégia 2: Detecção de Reversão de Tendência
A Configuração: O preço esteve em tendência de baixa, atingindo repetidamente as bandas inferiores.
O Sinal: O preço salta da 2ª ou 3ª banda inferior E o Nonlag Candle muda de VERMELHO para VERDE.
Sua Ação: Entre comprado imediatamente. A estrutura do mercado acabou de mudar de baixa para alta.
Por Que Funciona: Você está capturando a reversão em seu nascimento, não depois que ela já se moveu mais de 100 pips.
Estratégia 3: Realizando Lucros Como um Profissional
Negociação de Alta:
- Entrada: Perto da Nonlag Candle durante tendência de alta
- Lucro parcial: Quando o preço atinge a 1ª banda superior (scalp rápido)
- Lucro total: Quando o preço atinge a 2ª ou 3ª banda superior (extensão máxima)
Por Que Funciona: As bandas mostram níveis estatisticamente extremos de preço. Quando o preço alcança a 3ª banda, a probabilidade favorece fortemente uma retração - traders institucionais estão realizando lucros ali, e você também deve.
🔥 O Que Torna Isso Diferente das Médias Móveis Comuns
Médias móveis padrão têm alto tempo de atraso (3-10+ barras atrás), não possuem zonas de sobrecompra/sobrevenda, mostram apenas uma linha básica, não integram volume, fornecem timing de entrada tardio e produzem muitos sinais falsos.
INSTITUCIONAL Nonlag Candle tem tempo de atraso quase zero com resposta em tempo real, inclui 3 níveis de bandas de desvio, velas e linha codificadas por cores, integração opcional de volume, timing de entrada ideal e sinais filtrados pelas bandas de desvio.
A diferença é clara: enquanto médias móveis tradicionais fazem você correr atrás do mercado, este indicador coloca você à frente do movimento.
💰 Cenários Reais de Negociação
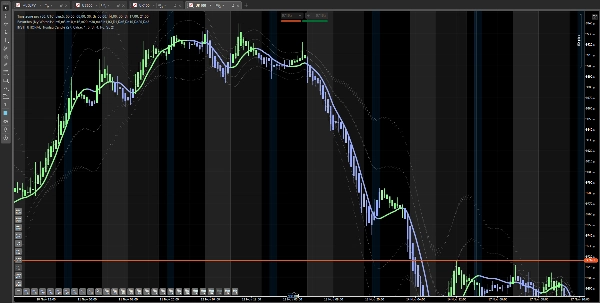
Cenário 1: A Retração Perfeita Você vê o UK100 subindo fortemente. O preço dispara para a 3ª banda superior. Em vez de comprar por FOMO, você espera. O preço recua para a linha verde Nonlag Candle. A linha permanece verde. ENTRADA. Resultado: Você comprou 80 pontos mais barato que a multidão que correu atrás.
Cenário 2: Evitando a Armadilha EUR/USD está caindo. Ele salta da 2ª banda inferior. A maioria dos traders compraria aqui, mas o Nonlag Candle ainda está VERMELHO. Você fica fora. O preço cai mais 50 pips. Você acabou de salvar sua conta.
Cenário 3: O Sonho do Scalper Você está fazendo scalping em gráficos de 5 minutos. Nonlag Candle fica verde. Você entra. O preço atinge a 1ª banda superior em 15 minutos. Você sai com 20 pips. Repete 4-5 vezes por sessão. São 80-100 pips diários com risco mínimo.
🎓 Quem Deve Usar Este Indicador?
✅ Day Traders - Entradas e saídas rápidas com sinais precisos
✅ Scalpers - As bandas fornecem alvos de lucro perfeitos
✅ Swing Traders - Identificam mudanças importantes de tendência cedo
✅ Iniciantes - Sistema codificado por cores facilita a tomada de decisão
✅ Profissionais - Ferramentas de nível institucional para negociações sérias
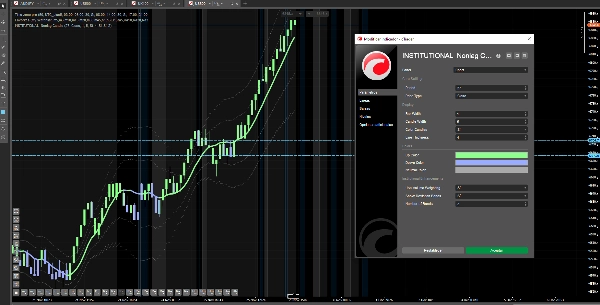
⚙️ Totalmente Personalizável
- Ajuste de período - Otimize para qualquer intervalo de tempo (1min a Diário)
- Seleção do tipo de preço - Fechamento, Típico, Ponderado ou personalizado
- Níveis das bandas - Escolha 1, 2 ou 3 bandas de desvio
- Esquemas de cores - Combine com a estética do seu gráfico
- Ponderação por volume - Ative/desative conforme sua estratégia
🛡️ Gestão de Risco Integrada
As bandas de desvio não são apenas para entradas - são seu sistema de gestão de risco:
- Stop Loss: Coloque abaixo da linha Nonlag Candle (ou abaixo da 1ª banda para stops mais apertados)
- Dimensionamento de Posição: Reduza o tamanho ao entrar nas 2ª/3ª bandas (movimentos estendidos)
- Alvos de Lucro: Visíveis automaticamente pelas bandas - sem adivinhação
🚀 Comece a Negociar com Mais Inteligência Hoje
Este não é apenas mais um média móvel. É um sistema completo de negociação que mostra para você:
✅ Quando entrar (mudança de cor + posição da banda)
✅ Quando esperar (preço nas bandas extremas)
✅ Quando sair (banda oposta atingida)
✅ Quando ficar fora (sinais conflitantes)
Pare de negociar com indicadores desatualizados. Comece a negociar com inteligência institucional.
📈 Funciona em Todos os Mercados
- Forex (EUR/USD, GBP/USD, USD/JPY, etc.)
- Índices (US30, UK100, NAS100, GER40)
- Commodities (Ouro, Petróleo, Prata)
- Criptomoedas (BTC, ETH)
- Todos os intervalos de tempo (1min a Mensal)
🎁 Oferta por Tempo Limitado
Adquira INSTITUCIONAL Nonlag Candle hoje e transforme sua negociação de reativa para proativa.
Negocie com confiança. Negocie com precisão. Negocie com ferramentas institucionais.
Este indicador é compatível com a plataforma cTrader. Compra única, atualizações vitalícias incluídas.
Resumo
Avaliações de clientes
5 | 50 % | |
4 | 50 % | |
3 | 0 % | |
2 | 0 % | |
1 | 0 % |


![Logótipo de "[Stellar Strategies] Smart ADX"](https://cdn.ctrader.com/image/webp/af13b084-b6f6-41db-b7bc-c7e688b57b05_36929)
