
Descrição
🧠 O que é (na prática)
Este é um VWAP Dinâmico Ancorado em Swing que se reancora automaticamente no último pivot de swing significativo (máximo/mínimo). Em vez de depender de âncoras fixas de sessão, ele se adapta à estrutura do mercado e destaca continuamente uma zona realista de “valor justo” baseada na dinâmica de preço e volume.
🧩 Estrutura de swing (lógica do pivot)
Usando o Período de Swing, o indicador detecta pontos de reversão principais:
- Pivot Alto quando o preço forma o máximo mais alto dentro da janela de análise
- Pivot Baixo quando o preço forma o mínimo mais baixo dentro da janela de análise
Quando o pivot ativo muda, o segmento do VWAP é resetado e reancorado, fornecendo um contexto estrutural claro.
⚙️ Comportamento adaptativo do VWAP (APT + volatilidade)
Com Rastreamento Adaptativo de Preço (APT), o VWAP pode ser ajustado para ser mais rígido ou mais suave:
- APT menor → reação mais rápida (mais próximo do preço)
- APT maior → reação mais lenta (visão macro mais limpa)
Se a adaptação à volatilidade estiver ativada, o APT ajusta automaticamente usando a relação ATR, tornando o indicador mais responsivo durante alta volatilidade e mais suave em condições calmas.
🚦 Como ler (sinais chave)
✅ Mudança de estrutura (mudança de âncora) → potencial mudança de regime / nova fase do mercado
✅ Preço acima/abaixo do VWAP → filtro de viés altista/baixista
✅ Rompimento e reteste do VWAP → uma das confirmações mais fortes
✅ Rótulos HH/HL vs LH/LL → qualidade da tendência e força de continuação
✅ Inclinação do VWAP → momentum e saúde do mercado
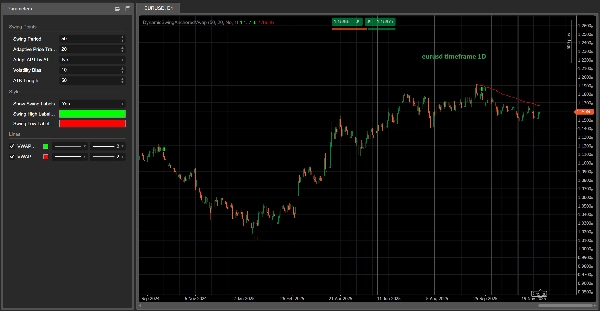
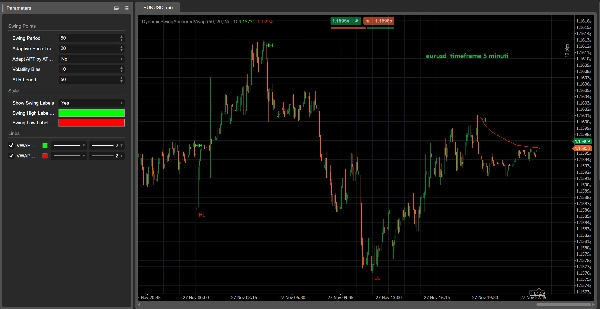
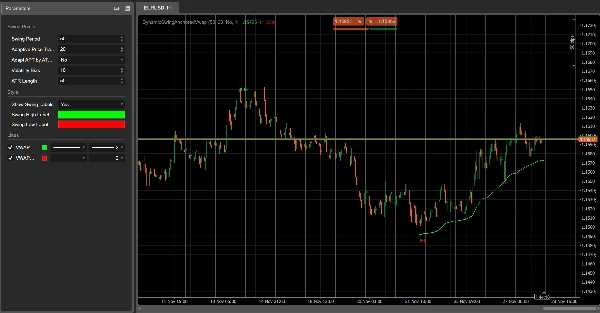
🖼️ Vantagem multi-temporal (visível nas capturas de tela)
As capturas de tela mostram claramente que, ao analisar o mesmo ativo em múltiplos intervalos de tempo, o indicador atualiza e realinha aos swings de cada intervalo — facilitando identificar quando os intervalos estão alinhados (sinais mais fortes) ou em conflito (mais incerteza/faixa). Isso fornece um viés direcional claro sobre onde o mercado tem maior probabilidade de se mover a seguir.
📩 Quer o melhor desempenho? Contate-nos!
Se você quer as melhores otimizações, ajuste de parâmetros personalizado para seu ativo/intervalo, e acesso às nossas ferramentas de trading fantásticas, sinta-se à vontade para nos contatar — ajudaremos você a obter os sinais mais limpos e a configuração mais eficaz para sua estratégia. 🚀
Resumo
This indicator features Adaptive Price Tracking (APT), allowing users to adjust the VWAP’s sensitivity for faster or smoother reactions to price changes. When volatility adaptation is enabled, APT automatically adjusts based on the Average True Range (ATR) ratio, enhancing responsiveness during volatile periods and smoothing during calmer markets.
Key signals include detecting structure shifts via anchor changes, price positioning relative to the VWAP for bullish or bearish bias, break and retest patterns of the VWAP as confirmation setups, trend quality through higher highs/lows versus lower highs/lows, and VWAP slope indicating momentum and market health.
The indicator supports multi-timeframe analysis by realigning to each timeframe’s swings, helping identify alignment or conflict across timeframes for clearer directional bias. It is applicable across various markets including Forex, cryptocurrencies, commodities, indices, and stocks.
Avaliações de clientes
5 | 100 % | |
4 | 0 % | |
3 | 0 % | |
2 | 0 % | |
1 | 0 % |


