
説明
🚀 ICTオーダーブロックアドバンスド - プロフェッショナルトレーディングインジケーター
最も完全なオーダーブロックシステムでICTの概念をマスターしよう
ICTオーダーブロックアドバンスド はICT(インナーサークルトレーダー)メソッドに従うトレーダーのための究極のツールです。これは単なるオーダーブロックインジケーターではなく、オーダーブロック、フェアバリューギャップ、流動性ゾーン、ブレーカーブロック、市場構造を一つにまとめた強力な機関取引システムです。
💎 なぜこれが最も高度なオーダーブロックインジケーターなのか
このインジケーターは5つの重要なICTの概念を一つのシームレスなシステムに統合しています:
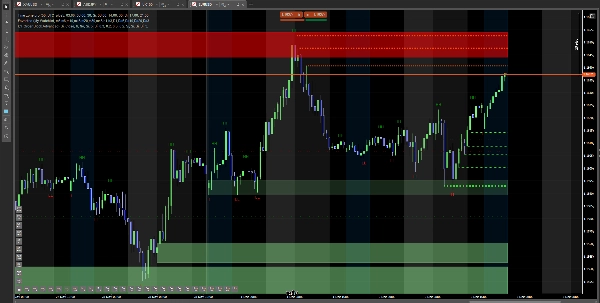
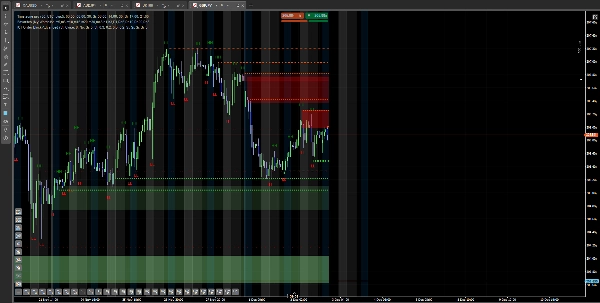
✅ オーダーブロック(OB) - 機関が注文を置いた場所
✅ フェアバリューギャップ(FVG) - 機関が埋める必要のある不均衡
✅ 流動性ゾーン - ストップが蓄積される場所(スイープターゲット)
✅ ブレーカーブロック - 失敗したOBが反転ゾーンになるもの
✅ 市場構造 - BOS/CHoCHを伴うHH、HL、LH、LLの識別
これはICTメソッドの最も純粋で実用的な形です。
✨ これが他と違う主な特徴
🎯 スマートオーダーブロック検出
- 機関のオーダーブロックを自動的に識別
- 最新の6つのブロックを表示(カスタマイズ可能1-15)
- 方向別に色分け(緑=強気、赤=弱気)
- 緩和されたら自動で削除
📊 品質スコアリングシステム(A+からCまで)
- 各オーダーブロックを品質で評価(A+, A, B, C)
- 出来高、サイズ、構造、合流を考慮
- 高評価=高確率のトレード
- 視覚的透明性で品質を即座に表示
🎨 フェアバリューギャップ(FVG)検出
- 強気・弱気の不均衡を識別
- カスタマイズ可能な色(緑/赤ゾーン)
- 埋まったら自動で削除
- 価格が戻る可能性のある場所を表示
💰 流動性ゾーンマッピング
- 最近の高値/安値をマーク(流動性プール)
- 機関がストップをスイープする場所を表示
- 線の太さ=流動性の強さ
- 流動性獲得トレードに最適
🔄 ブレーカーブロック識別
- オーダーブロックの失敗と反転を検出
- 元のサポートがレジスタンスに(その逆も)
- 機関の罠ゾーンを表示
- 上級トレーダーの秘密兵器
📈 完全な市場構造
- HH(高値更新)、HL(安値切り上げ)をマーク
- LH(高値切り下げ)、LL(安値更新)をマーク
- トレンドラインを自動で描画
- BOS(構造の破壊)とCHoCH(性格の変化)を識別
⚡ ボラティリティフィルター
- オプションのATRベースフィルター
- 高ボラティリティ時のみOBを表示
- 弱い/低品質のブロックを除外
- 機関グレードのセットアップに集中
🎯 プロのICTトレーダーはこう使う
戦略1:高品質オーダーブロックエントリー
セットアップ: 市場がオーダーブロックを作り、インジケーターが「A+」または「A」と評価する
トレード:
- 価格がOBゾーンに戻るのを待つ
- 価格がOBに触れたらエントリー(緑/赤の長方形で表示)
- ストップロス:OBの外側
- ターゲット:次の流動性ゾーンまたは反対側のOB
なぜ機能するのか: A+評価のブロックは最も高い機関の関心を持つ - 出来高、構造、合流がすべて一致。これらは機関が守るブロックです。
戦略2:フェアバリューギャップ+オーダーブロックの合流
完璧なセットアップ:
- オーダーブロックが形成される(緑の長方形)
- 同じレベルにフェアバリューギャップが現れる(薄い緑ゾーン)
- 価格がこの合流ゾーンに戻る
エントリー: 両方のゾーンが一致したときにロングエントリー。機関の関心が2倍=確率も2倍。
なぜ強力なのか: 機関は同じ価格に2種類の非効率性を残している - 彼らはここに戻ってくる。
戦略3:流動性スイープからオーダーブロックへ
ICTクラシック:
- 流動性ゾーンを特定(最近の安値の点線)
- 価格がその下をスイープ(小口投資家のストップを取る)
- 価格がすぐに強気のオーダーブロックに反転
- ロングエントリー - 機関が流動性を獲得し、今買っている
なぜこれが金のように価値があるのか: これが機関の動き方:流動性をスイープ(小口投資家のストップ)、その後価格を逆方向に押す。あなたは反転を捕まえている。
戦略4:ブレーカーブロック反転
セットアップ:
- 強気のオーダーブロックが緩和(破壊)される
- インジケーターがそれをブレーカーブロックとして表示(濃い緑の点線)
- 価格が上からテストのために戻る
トレード: 価格が上からブレーカーブロックに触れたらショート。サポートだったものが今はレジスタンス。
なぜ機能するのか: 機関はそのレベルを保持できなかった - 今は反対側から守っている。
戦略5:市場構造の確認
HH、HL、LH、LLの使用:
- 市場がHL(高値切り上げ)+HH(高値更新)を示す=強気構造
- HLでオーダーブロックが形成される
- ロングバイアスのみ - 構造が方向を確認
BOS vs CHoCH:
- BOS(構造の破壊)=トレンド継続
- CHoCH(性格の変化)=トレンド反転
- 現在の構造に合ったOBのみトレード
🔥 基本的なオーダーブロックインジケーターと何が違うのか
基本的なOBインジケーター はオーダーブロックのみ表示し、品質評価なし、フェアバリューギャップなし、流動性ゾーンなし、ブレーカーブロックなし、市場構造なし、すべてのOBを同等に扱います。
ICTオーダーブロックアドバンスド は完全なICTシステム(5つの概念)を表示し、OBの品質を評価(A+からC)、フェアバリューギャップを自動識別、流動性ゾーンをマッピング、ブレーカーブロックを検出、市場構造(HH/HL/LH/LL)をマーク、ボラティリティフィルターを搭載し、合流ゾーンを表示します。
これは単なるツールと完全な取引システムの違いです。
🎓 このインジケーターが必要な人は?
✅ ICT学生 - ICTの概念を正しく学び適用する
✅ オーダーブロックトレーダー - 品質評価されたOBを合流と共に得る
✅ スマートマネートレーダー - すべての機関の足跡を見る
✅ 流動性トレーダー - スイープの機会を識別する
✅ 構造トレーダー - 自動HH/HL/LH/LLマーキング
✅ 真剣なトレーダー - 単一の概念ではなく完全なシステム
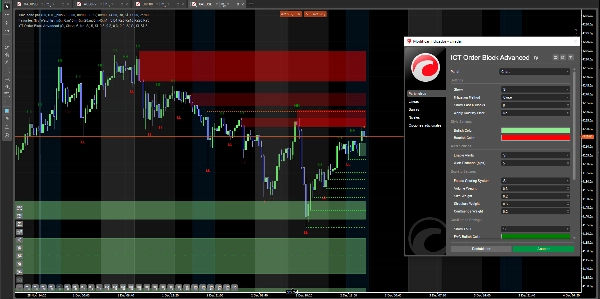
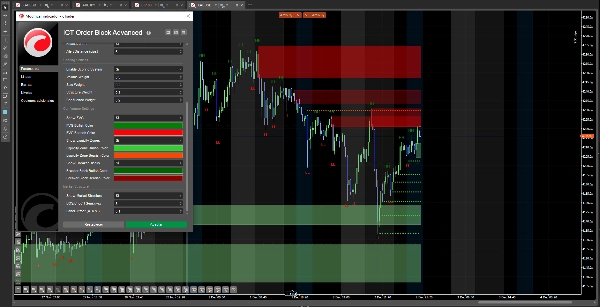
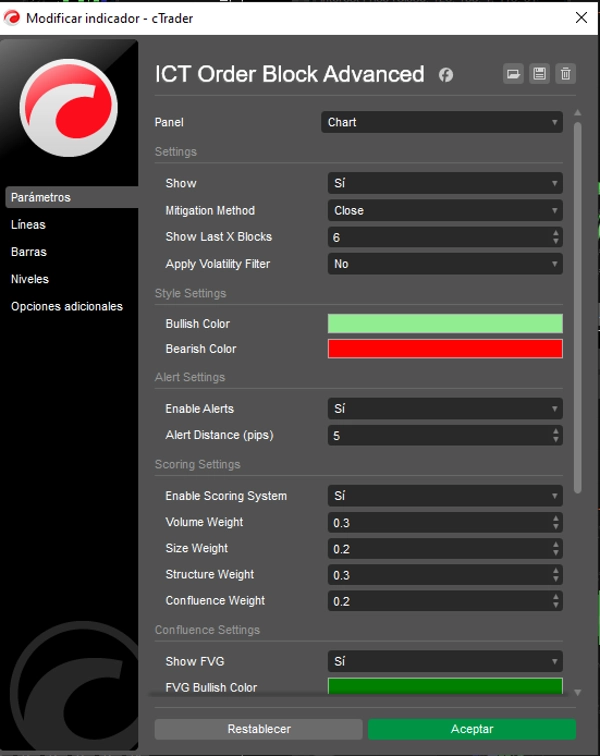
⚙️ 完全にカスタマイズ可能
オーダーブロック設定:
- 最後のXブロックを表示(1-15、デフォルト6)
- 緩和方法(クローズまたはウィック)
- ボラティリティフィルターのオン/オフ
- カスタムカラー(強気/弱気)
品質スコアリングシステム:
- スコアリングの有効/無効
- 重みの調整:出来高、サイズ、構造、合流
- 品質によるカスタム透明度
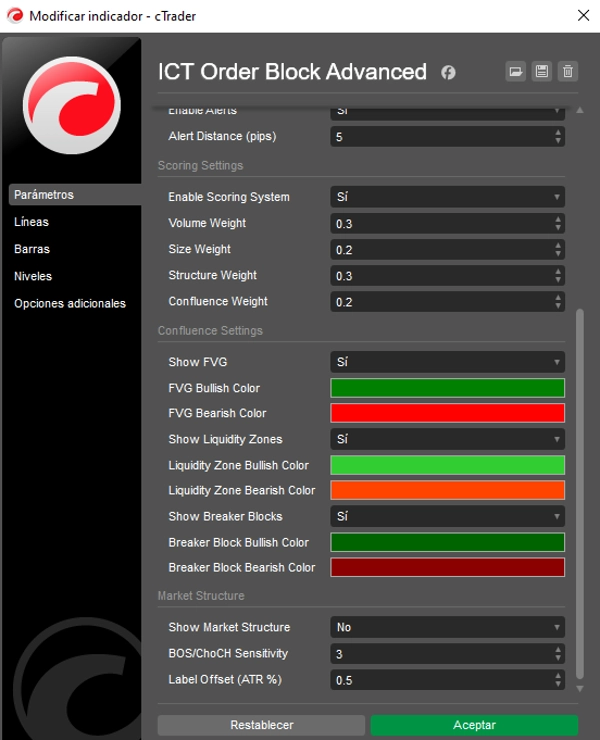
合流機能:
- フェアバリューギャップの表示/非表示(カスタムカラー)
- 流動性ゾーンの表示/非表示(カスタムカラー)
- ブレーカーブロックの表示/非表示(カスタムカラー)
市場構造:
- HH/HL/LH/LLマーカーの表示/非表示
- BOS/CHoCH感度(1-10)
- ラベルオフセット調整
- 自動トレンドライン描画
🛡️ リスク管理内蔵
ストップロスの配置:
- オーダーブロックの境界のすぐ外側
- ブレーカーブロックの下/上
- フェアバリューギャップの外側
エントリー確認:
- AまたはA+評価のブロックを待つ
- 合流を探す(OB + FVG + 流動性)
- 市場構造(ロングの場合はHH/HL)で確認
ポジションサイズ:
- 合流のあるA+ブロックで大きく
- A評価のブロックで中くらい
- B/Cブロックまたは単独セットアップで小さく
利益目標:
- 次の流動性ゾーン
- 反対側のオーダーブロック
- 反対側のフェアバリューギャップ
- 市場構造レベル(HH/LL)
🚀 必要な完全なICTシステム
このインジケーターはすべてのICTトレーダーの疑問に答えます:
✅ オーダーブロックはどこ?(緑/赤の長方形と評価付き)
✅ どのOBが最高品質?(A+, A, B, C評価)
✅ フェアバリューギャップはどこ?(薄緑/赤ゾーン)
✅ 流動性はどこ?(高値/安値の点線)
✅ ブレーカーブロックはアクティブ?(濃い点線)
✅ 市場構造は?(HH、HL、LH、LLマーカー)
✅ これはBOSかCHoCHか?(トレンドラインが構造の破壊を示す)
複数のインジケーターを組み合わせるのはやめて、完全なICTシステムを手に入れましょう。
📈 すべての市場と時間軸で機能
- 外国為替 - すべての通貨ペア(ICTの主要市場)
- 株価指数 - NAS100、US30、UK100、SPX500、GER40
- コモディティ - 金、銀、石油
- 暗号通貨 - ビットコイン、イーサリアム
- 時間軸 - 1分から日足まで(ICTには5分〜1時間が最適)
注意: ICTの概念は機関参加のある流動性の高い市場で最も効果的です。
🎁 今日からICTトレーディングをマスターしよう
部分的なシステムに苦労するのはやめて、一つのインジケーターで完全なICTメソッドを手に入れましょう。
オーダーブロックを見て、品質を評価し、合流を見つけ、構造をトレードし、流動性を追いかけよう。
cTrader対応。買い切り型、永久アップデート付き。
概要
Key features include automatic detection and color-coded display of recent order blocks with a quality grading system (A+ to C) based on volume, size, structure, and confluence. It identifies bullish and bearish Fair Value Gaps and liquidity pools, maps breaker blocks for reversal zones, and marks market structure with trend lines. An optional ATR-based volatility filter highlights high-probability setups.
The indicator supports multiple markets including Forex, indices, commodities, cryptocurrencies, and stocks, and works across timeframes from 1 minute to daily (optimal 5 minutes to 1 hour). It offers customizable settings for block display, scoring weights, colors, and structure sensitivity.
ICT Order Block Advanced also provides built-in risk management guidance with stop loss placement beyond order blocks or breaker blocks, entry confirmation through confluence and market structure, and position sizing recommendations based on block quality. This tool consolidates ICT concepts into a unified system for institutional-level market analysis.


