
Descrição
EMAScalpHistogram: Visualização de Momentum para Gestão de Negócios
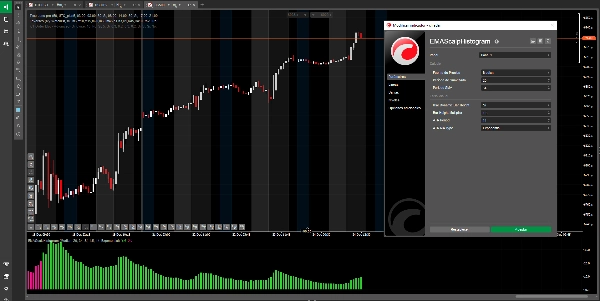
O que é o EMAScalpHistogram?
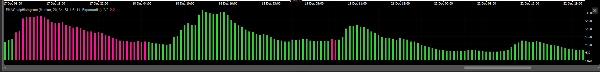
EMAScalpHistogram é uma ferramenta avançada de análise técnica que transforma a complexidade do momentum do mercado em um histograma intuitivo e visualmente atraente. Seu design permite a identificação da força e direção da tendência em um único olhar.
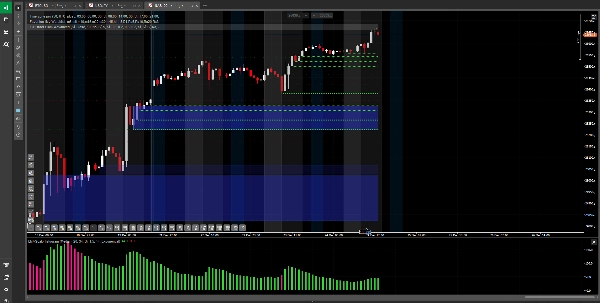
- Barras Verdes (Altista): Indicam forte momentum de compra, sugerindo que os compradores estão no controle do mercado.
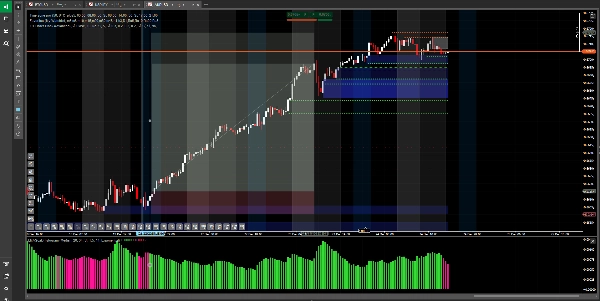
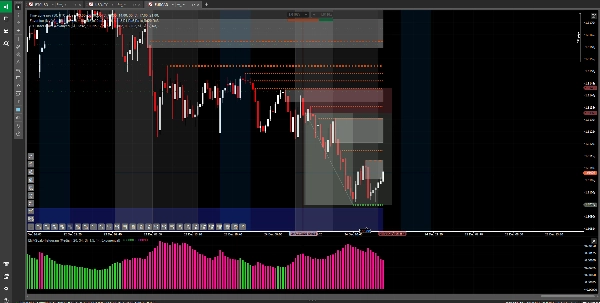
- Barras Cor-de-rosa (Baixista): Indicam forte momentum de venda, sugerindo que os vendedores estão dominando a ação do preço.
- Altura Dinâmica: A altura das barras não é fixa; ela se adapta à volatilidade do mercado. Barras mais altas sinalizam movimentos com mais força e convicção, enquanto barras mais curtas indicam uma pausa ou uma tendência enfraquecida.
Uso Principal e Estratégia Recomendada
EMAScalpHistogram é uma ferramenta de gestão de negociações de elite, projetada para traders que buscam maximizar lucros mantendo posições com maior confiança. Seu maior valor está em ajudar você a manter e amplificar seus lucros uma vez que você já esteja em uma negociação.
- Confirmação de Tendência: Sua função mais poderosa é validar a força de uma tendência que você já identificou. Se você está em uma posição longa e o histograma mostra consistentemente barras verdes, é uma confirmação visual de que o momentum de compra permanece intacto.
- Gestão de Negócios (Manter e Amplificar Lucros):
-
- Para Manter Posições: Esta é sua aplicação mais valiosa. Use-a para decidir quando manter uma posição com confiança. Se o histograma continuar mostrando barras a seu favor, isso lhe dá a disciplina para não fechar uma negociação lucrativa prematuramente devido a pequenas flutuações do mercado.
- Para Amplificar Lucros: Ao ajudar você a manter a posição durante toda a fase de momentum forte, permite capturar movimentos maiores e ampliar seu potencial de lucro.
- Alerta para Enfraquecimento do Momentum: Uma mudança na cor do histograma (de verde para cor-de-rosa ou vice-versa) é um dos primeiros alertas de que o momentum está se esgotando, sugerindo que pode ser um bom momento para garantir lucros ou ajustar sua estratégia de saída.
O que Evitar
Não é um Sinal de Entrada: Criticamente, o EMAScalpHistogram não foi projetado para ser usado como um sinal independente para abrir novas negociações. Como um indicador que confirma a força de um movimento já em andamento, usá-lo para entrada pode resultar em negociações tardias com alto risco e potencial de lucro limitado.
Aviso de Risco e Isenção de Responsabilidade
O uso deste indicador é por sua conta e risco e responsabilidade. Negociar instrumentos financeiros envolve um alto nível de risco e pode não ser adequado para todos os investidores. Esta ferramenta não constitui uma recomendação de investimento ou aconselhamento financeiro. Desempenho passado não garante resultados futuros. Recomenda-se fortemente testar qualquer estratégia em uma conta demo antes de arriscar capital real.
Resumo
Avaliações de clientes
5 | 67 % | |
4 | 33 % | |
3 | 0 % | |
2 | 0 % | |
1 | 0 % |


