Descrição
Força do Par (JPY) - Indicador de Força da Moeda
📊 O que é Força do Par (JPY)?
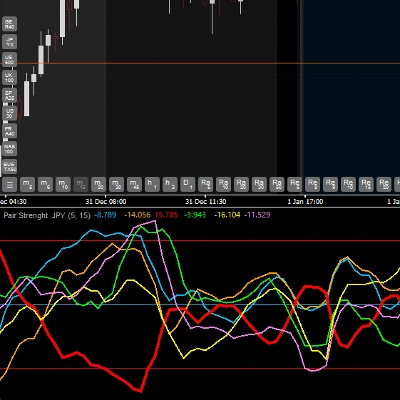
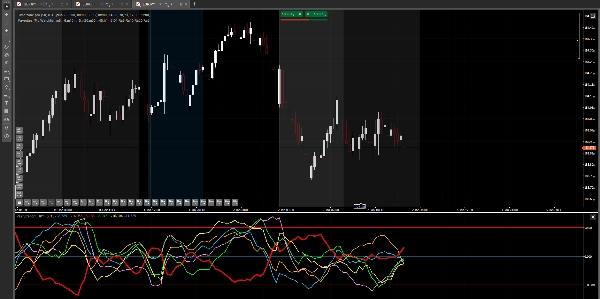
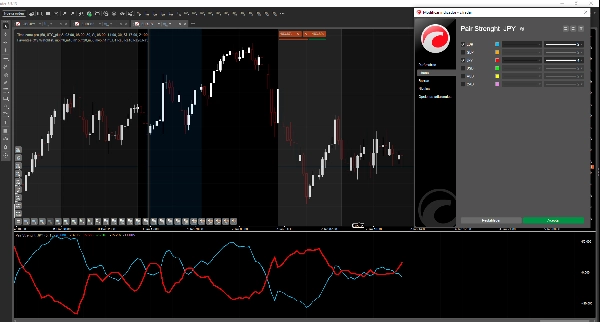
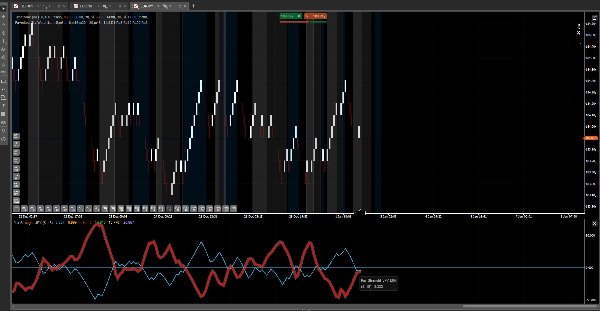
Força do Par (JPY) é um indicador avançado que analisa e compara a força relativa de 6 moedas principais em tempo real: EUR, GBP, JPY, USD, AUD e CAD. Ele usa o True Strength Index (TSI) para medir o momentum e a força de cada moeda, permitindo que você identifique quais moedas estão mais fortes ou mais fracas no mercado.
🎯 Principais Características
✅ Análise Multi-Moeda: Monitore 6 moedas simultaneamente em uma janela ✅ Identificação de Tendência: Detecte as moedas mais fortes e mais fracas no mercado ✅ Sinais de Sobrecompra/Sobrevenda: Níveis em 50, 0 e -50 para identificar extremos ✅ Confirmação de Trade: Ajuda a validar suas entradas comparando a força relativa ✅ Visual e Claro: Cada moeda tem sua própria cor para fácil identificação
💹 Pares Compatíveis
IMPORTANTE: Este indicador analisa a força de 6 moedas: EUR, GBP, JPY, USD, AUD e CAD
O indicador funciona APENAS com pares que incluem JPY (Iene Japonês), ou seja:
- EURJPY (Euro / Iene)
- GBPJPY (Libra / Iene)
- USDJPY (Dólar / Iene)
- AUDJPY (Dólar Australiano / Iene)
- CADJPY (Dólar Canadense / Iene)
⚠️ Seu corretor DEVE oferecer esses 5 pares com JPY para que o indicador funcione corretamente.
Não funciona com:
- Ouro, prata ou outros metais
- Índices de ações
- Criptomoedas
- Pares que não incluem JPY (como EURUSD, GBPUSD, etc.)
Você pode aplicar o indicador no gráfico de qualquer um dos 5 pares mencionados acima.
📈 Como Usar o Indicador
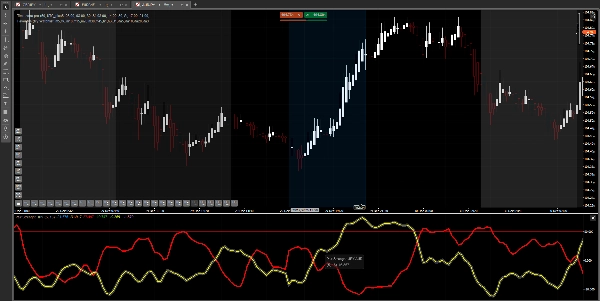
Interpretação da Linha:
Cada linha colorida representa a força de uma moeda:
- Linha para cima (valores positivos): A moeda está FORTE
- Linha para baixo (valores negativos): A moeda está FRACA
- Cruzamentos de linha: Mudança na força relativa entre moedas
Níveis Chave:
- Nível 50: Zona de sobrecompra - A moeda pode estar muito forte e próxima de reverter
- Nível 0: Linha neutra - Equilíbrio entre força e fraqueza
- Nível -50: Zona de sobrevenda - A moeda pode estar muito fraca e próxima de reverter
Estratégia Básica:
- Identifique a moeda MAIS FORTE (linha mais alta)
- Identifique a moeda MAIS FRACA (linha mais baixa)
- Negocie o par combinando ambas (exemplo: se EUR está forte e JPY está fraco → compre EURJPY)
- Confirme com os níveis: Evite comprar quando a moeda forte estiver em +50 ou vender quando a fraca estiver em -50
⚙️ Parâmetros Ajustáveis
- Período Rápido (Padrão: 5): Período rápido do TSI - valores menores = mais sensível
- Período Lento (Padrão: 15): Período lento do TSI - valores maiores = mais suave
Os valores padrão funcionam bem para a maioria das situações. Ajuste-os conforme seu estilo de negociação.
🔮 Atualizações Futuras
Estamos avaliando a possibilidade de adicionar mais pares de moedas (NZD, CHF, etc.) em versões futuras, dependendo da resposta e feedback dos usuários. No entanto, isso não é garantido e dependerá do desempenho do indicador e da demanda do mercado.
💡 Dicas de Uso
✓ Use em conjunto com sua estratégia principal, não como um sistema independente ✓ Combine com análise de ação de preço e níveis de suporte/resistência ✓ Pratique primeiro em uma conta demo antes de operar ao vivo ✓ Nem todos os sinais são vencedores - aplique gerenciamento de risco adequado ✓ Funciona melhor em timeframes M15 e superiores
📞 Suporte
Se você tiver dúvidas sobre a instalação ou uso do indicador, entre em contato conosco.
Nota Final: Este indicador é uma ferramenta de análise. O sucesso na negociação depende de múltiplos fatores, incluindo gerenciamento de risco, psicologia e experiência.
Resumo
This tool works exclusively with currency pairs that include the Japanese Yen (JPY), specifically EURJPY, GBPJPY, USDJPY, AUDJPY, and CADJPY. It does not support metals, stock indices, cryptocurrencies, or pairs without JPY. Users apply the indicator on any of the five JPY pairs to monitor multi-currency strength simultaneously in one window.
Adjustable parameters include the fast and slow periods of the TSI for sensitivity and smoothing. The indicator aids in trend identification, overbought/oversold signal detection, and trade confirmation by comparing relative currency strength. It is recommended for use alongside other analysis methods and on timeframes of 15 minutes or higher.
Avaliações de clientes
5 | 100 % | |
4 | 0 % | |
3 | 0 % | |
2 | 0 % | |
1 | 0 % |


