
Descrição
HiLo Marker: Descubra os Principais Pontos de Reversão do Mercado
HiLo Marker é um indicador intuitivo e essencial para cTrader, projetado para detectar e destacar automaticamente os preços máximos e mínimos significativos com base em uma janela histórica definida. Esta ferramenta traz clareza aos seus gráficos ao eliminar suposições na identificação de pontos de oscilação, oferecendo uma vantagem visual para qualquer trader de price action.
Como Funciona
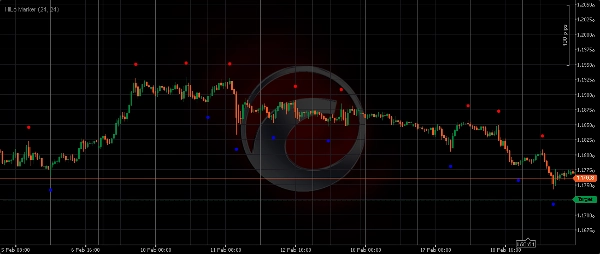
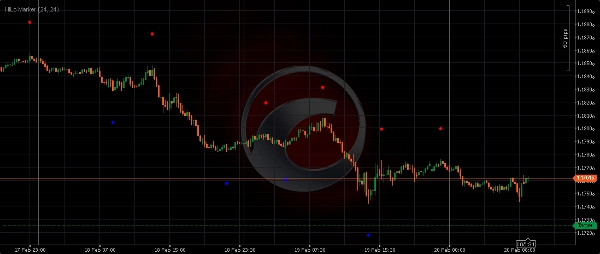
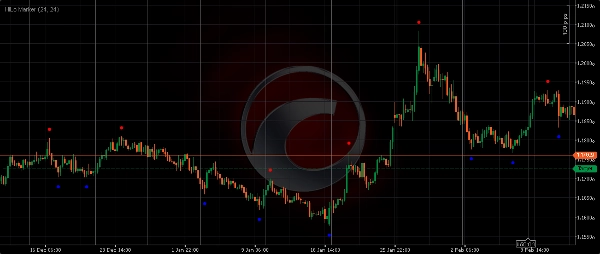
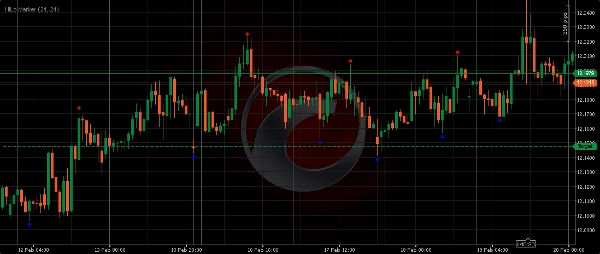
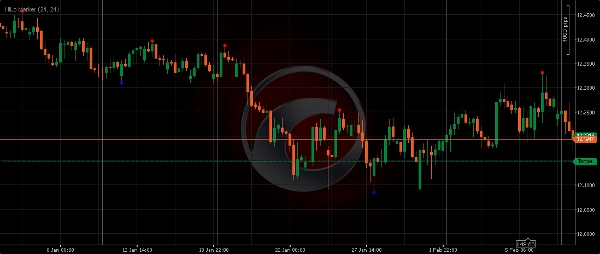
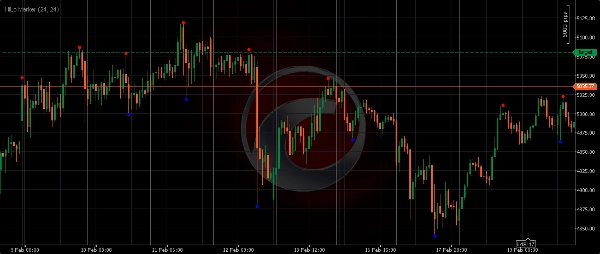
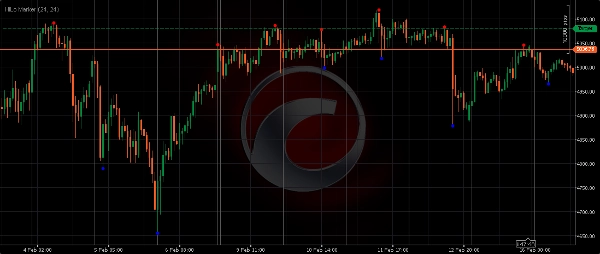
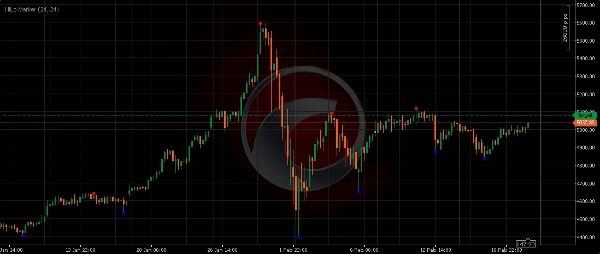
O indicador escaneia uma "Janela de Distância" especificada (número de barras) para encontrar a máxima mais alta absoluta e a mínima mais baixa dentro desse intervalo. Uma vez que uma barra é confirmada como o pico ou vale de sua janela circundante, HiLo Marker coloca um ponto distinto vermelho ou azul (ou seta) acima/abaixo dessa vela. Este método ajuda você a identificar objetivamente níveis cruciais onde o preço anteriormente reverteu ou encontrou forte momentum.
Principais Características e Benefícios
- Precisão Automatizada: Não é mais necessário desenhar linhas manualmente. HiLo Marker identifica objetivamente pontos críticos de reversão.
- Estrutura Clara do Mercado: Visualize instantaneamente oscilações, tendências e faixas, tornando a análise gráfica mais eficiente.
- Zonas de Suporte e Resistência: Os máximos e mínimos marcados frequentemente atuam como suporte e resistência futuros, oferecendo pontos de entrada/saída de alta probabilidade.
- Versátil: Funciona perfeitamente em todos os instrumentos financeiros (Forex, Ouro, Índices, Cripto, Ações) e em qualquer período de tempo.
- Visuais Personalizáveis: Ajuste as cores dos marcadores e a distância do deslocamento para integração perfeita no gráfico.
Parâmetros de Entrada Explicados:
- Comprimento (Deslocamento): Este valor determina o quão acima do máximo ou abaixo do mínimo o marcador será plotado. Um valor maior cria mais separação visual da vela.
-
- Exemplo:
Length = 24significa que o marcador aparecerá 24 pips (ou ticks, dependendo do símbolo) afastado do máximo/mínimo real.
- Exemplo:
- Janela de Distância: Este é o período de retrocesso que o indicador usa para identificar um máximo ou mínimo. Uma barra só é marcada como Hi/Lo se for o máximo/mínimo absoluto dentro do número especificado de barras ao redor.
-
- Menor
Dist(ex., 10-20): Captura oscilações menores e ruído de mercado de curto prazo (adequado para scalping). - Maior
Dist(ex., 30-60+): Identifica oscilações mais significativas, em nível institucional, e grandes reversões de tendência (ideal para swing trading ou prazos maiores).
- Menor
Melhore seu trading de price action com o HiLo Marker. Obtenha uma perspectiva mais clara da dinâmica do mercado e tome decisões mais informadas. Baixe agora!
Resumo
Avaliações de clientes
5 | 0 % | |
4 | 100 % | |
3 | 0 % | |
2 | 0 % | |
1 | 0 % |


